
The hardware and bandwidth for this mirror is donated by dogado GmbH, the Webhosting and Full Service-Cloud Provider. Check out our Wordpress Tutorial.
If you wish to report a bug, or if you are interested in having us mirror your free-software or open-source project, please feel free to contact us at mirror[@]dogado.de.
xplainfi
![]()
![]()
The goal of xplainfi is to collect common feature
importance methods under a unified and extensible interface.
It is built around mlr3 as available abstractions for learners, tasks, measures, etc. greatly simplify the implementation of importance measures.
Install xplainfi from CRAN:
install.packages("xplainfi")Or install from R-universe:
install.packages("xplainfi", repos = c("https://mlr-org.r-universe.dev", "https://cloud.r-project.org"))The latest development version of xplainfi can be
installed with pak:
# install.packages(pak)
pak::pak("mlr-org/xplainfi")Here is a basic example on how to calculate PFI for an untrained
learner and task, using cross-validation for resampling and computing
PFI within each resampling iteration 10 times on the
friedman1 task (see
?mlbench::mlbench.friedman1).
The friedman1 task has the following structure:
\[y = 10 \sin(\pi x_1 x_2) + 20(x_3 - 0.5)^2 + 10x_4 + 5x_5 + \varepsilon\]
Where \(x_{\{1,2,3,4,5\}}\) are
named important1 through important5 in the
Task, with additional numbered unimportant
features without effect on \(y\).
library(xplainfi)
library(mlr3learners)
#> Loading required package: mlr3

task = tgen("friedman1")$generate(1000)
learner = lrn("regr.ranger", num.trees = 100)
measure = msr("regr.mse")

pfi = PFI$new(
    task = task,
    learner = learner,
    measure = measure,
    resampling = rsmp("cv", folds = 3),
    n_repeats = 30
)
Compute and print PFI scores:
pfi$compute()
pfi$importance()
#> Key: <feature>
#>          feature   importance
#>           <char>        <num>
#>  1:   important1  8.183995584
#>  2:   important2  7.481268675
#>  3:   important3  1.571760349
#>  4:   important4 12.585739572
#>  5:   important5  2.810875567
#>  6: unimportant1  0.030667439
#>  7: unimportant2 -0.002837696
#>  8: unimportant3 -0.044922079
#>  9: unimportant4 -0.060054450
#> 10: unimportant5  0.060148388
If it aids interpretation, importances can also be calculated as the ratio rather than the difference between the baseline and post-permutation losses:
pfi$importance(relation = "ratio")
#> Key: <feature>
#>          feature importance
#>           <char>      <num>
#>  1:   important1  2.6987668
#>  2:   important2  2.5598945
#>  3:   important3  1.3294180
#>  4:   important4  3.6278508
#>  5:   important5  1.5874860
#>  6: unimportant1  1.0067957
#>  7: unimportant2  0.9994507
#>  8: unimportant3  0.9905990
#>  9: unimportant4  0.9874657
#> 10: unimportant5  1.0126572
When PFI is computed based on resampling with multiple iterations,
and / or multiple permutation iterations, the individual scores can be
retrieved as a data.table:
str(pfi$scores())
#> Classes 'data.table' and 'data.frame':   900 obs. of  6 variables:
#>  $ feature          : chr  "important1" "important1" "important1" "important1" ...
#>  $ iter_rsmp        : int  1 1 1 1 1 1 1 1 1 1 ...
#>  $ iter_repeat      : int  1 2 3 4 5 6 7 8 9 10 ...
#>  $ regr.mse_baseline: num  4.56 4.56 4.56 4.56 4.56 ...
#>  $ regr.mse_post    : num  12.3 11.9 11.3 12.1 13.6 ...
#>  $ importance       : num  7.77 7.33 6.74 7.56 9.06 ...
#>  - attr(*, ".internal.selfref")=<externalptr>
Where iter_rsmp corresponds to the resampling iteration,
i.e., 3 for 3-fold cross-validation, and iter_repeat
corresponds to the permutation iteration within each resampling
iteration, 5 in this case. While pfi$importance() contains
the means across all iterations, pfi$scores() allows you to
manually visualize or aggregate them in any way you see fit.
For example:
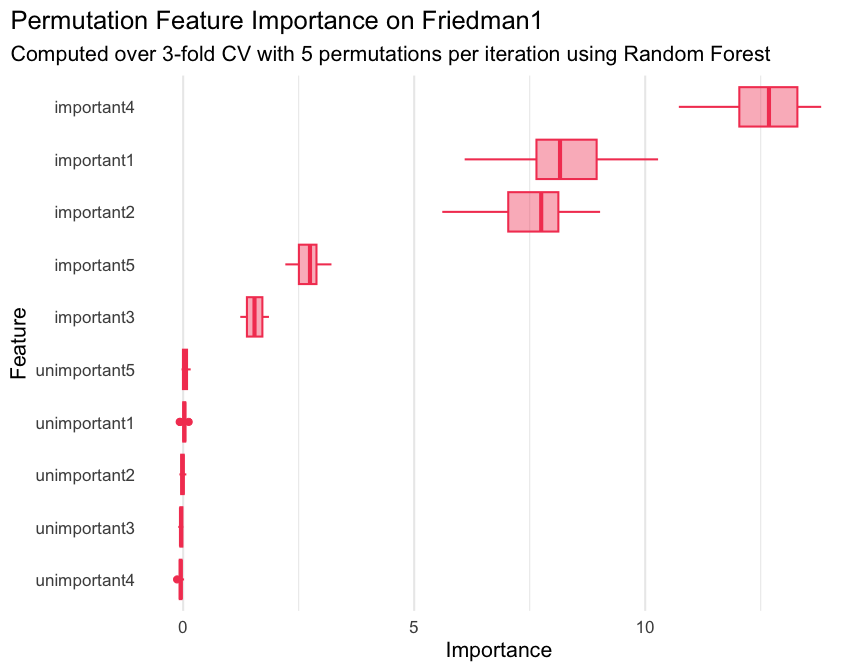
library(ggplot2)

ggplot(
    pfi$scores(),
    aes(x = importance, y = reorder(feature, importance))
) +
    geom_boxplot(color = "#f44560", fill = alpha("#f44560", 0.4)) +
    labs(
        title = "Permutation Feature Importance on Friedman1",
        subtitle = "Computed over 3-fold CV with 5 permutations per iteration using Random Forest",
        x = "Importance",
        y = "Feature"
    ) +
    theme_minimal(base_size = 16) +
    theme(
        plot.title.position = "plot",
        panel.grid.major.y = element_blank()
    )
If the measure in question needs to be maximized rather than
minimized (like \(R^2\)), the internal
importance calculation takes that into account via the
$minimize property of the measure and calculates
importances such that the intuition “performance improvement” ->
“higher importance score” still holds:
pfi = PFI$new(
    task = task,
    learner = learner,
    measure = msr("regr.rsq")
)
#> ℹ No <Resampling> provided, using `resampling = rsmp("holdout", ratio = 2/3)`
#>   (test set size: 333)

pfi$compute()
pfi$importance()
#> Key: <feature>
#>          feature   importance
#>           <char>        <num>
#>  1:   important1  0.329915393
#>  2:   important2  0.297695022
#>  3:   important3  0.063613087
#>  4:   important4  0.493673768
#>  5:   important5  0.121794662
#>  6: unimportant1  0.003972813
#>  7: unimportant2  0.002157623
#>  8: unimportant3 -0.002780577
#>  9: unimportant4  0.001914150
#> 10: unimportant5  0.001366645
See vignette("xplainfi") for more examples.
These binaries (installable software) and packages are in development.
They may not be fully stable and should be used with caution. We make no claims about them.
Health stats visible at Monitor.