



The hardware and bandwidth for this mirror is donated by dogado GmbH, the Webhosting and Full Service-Cloud Provider. Check out our Wordpress Tutorial.
If you wish to report a bug, or if you are interested in having us mirror your free-software or open-source project, please feel free to contact us at mirror[@]dogado.de.
The xiacf package provides a robust framework for detecting complex non-linear and functional dependence in time series data. Traditional linear metrics, such as the standard Autocorrelation Function (ACF) and Cross-Correlation Function (CCF), often fail to detect symmetrical or purely non-linear relationships.
This package overcomes these limitations by utilizing
Chatterjee’s Rank Correlation (), offering both univariate (
-ACF) and multivariate (
-CCF) analysis tools. It features rigorous
statistical hypothesis testing powered by advanced surrogate data
generation algorithms (IAAFT and MIAAFT) and dynamic Family-Wise Error
Rate (FWER) control, all implemented in high-performance C++ using
RcppArmadillo.
If you use xiacf in your research, please cite our
latest working paper detailing the methodology:
Watanabe, Y. (2026). Differential diagnosis of nonlinearity: Integrating the BDS omnibus test with chatterjee’s xi for local structural identification. In Social Science Research Network. https://doi.org/10.2139/ssrn.6829431
X leads Y vs Y leads X) and captures
contemporaneous effects (Lag 0) where traditional Pearson CCF
fails.xi_matrix): Simultaneously evaluate causal
pathways across an entire system of time series to build directed
non-linear networks.xiacf uniquely implements a Dual-Family
FWER Control. It completely decouples the significance
thresholds for pure contemporaneous effects (Lag 0) and temporal causal
propagation (Lag > 0), maximizing the statistical power to detect
delayed causal spillovers.autoplot() methods
instantly generate beautiful, unified, and publication-ready
ggplot2 visualizations.doFuture) rolling window functions to
capture time-varying dependencies smoothly and efficiently.You can install the stable version of xiacf from CRAN with:
install.packages("xiacf")You can install the development version from GitHub with:
# install.packages("remotes")
remotes::install_github("yetanothersu/xiacf")Detecting strong non-linear auto-dependence that standard linear ACF fails to capture.
### 1. Univariate Non-linear ACF (xi-ACF)

library(xiacf)
library(ggplot2)

set.seed(42)
n <- 300

# Generate a series with V-shaped auto-dependence (mean zero)
# Standard Pearson ACF will miss this, but Xi-ACF will detect it.
A <- numeric(n)
A[1] <- rnorm(1)
for (t in 2:n) {
  # Subtracting 0.8 keeps the series centered around 0
  A[t] <- abs(A[t - 1]) - 0.8 + rnorm(1, sd = 0.2)
}

res_acf <- xi_acf(A, max_lag = 5, n_surr = 249)
#> Warning in check_surrogate_count(n_surr = n_surr, sig_level = sig_level, : For
#> 5 simultaneous tests at sig_level = 0.05, the empirical distribution of the
#> max-statistic may be unstable with n_surr = 249. Recommended n_surr is at least
#> 399.
print(res_acf)
#>
#> === Univariate Xi-Autocorrelation Function ===
#> Time series length: 300
#> Max Lag: 5
#> Surrogates (IAAFT): 249
#> Significance Level: 0.05 (FWER controlled)
#> ==============================================
#> Significant Lags:
#>  Lag        Xi Global_Threshold Xi_Excess
#>    1 0.4470805        0.2976711 0.1494094
autoplot(res_acf)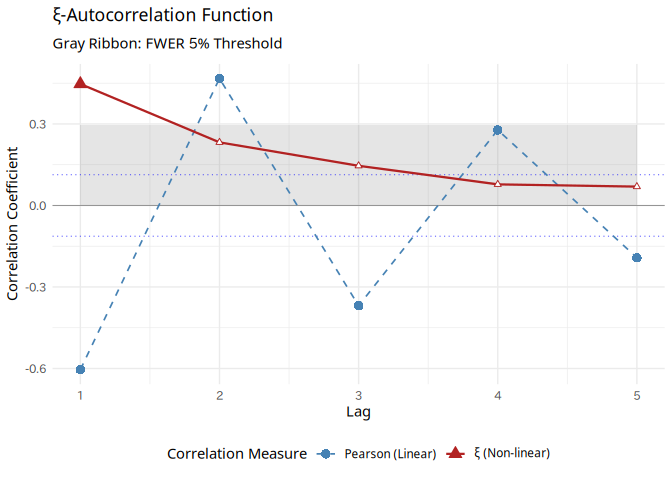
Discovering hidden causal pathways across different time series.
### 2. Bivariate Non-linear CCF (xi-CCF)

# X is pure noise (mean 0, symmetric)
X <- rnorm(n)
Y <- numeric(n)

# Y is a purely quadratic function of X at lag 2
for (t in 3:n) {
  Y[t] <- X[t - 2]^2 + rnorm(1, sd = 0.2)
}

# Center Y so it contains both negative and positive values.
# Without this, Y is always positive, making abs(Y) purely linear later!
Y <- as.numeric(scale(Y))

res_ccf <- xi_ccf(X, Y, max_lag = 5, n_surr = 249, direction = "both")
#> Warning in check_surrogate_count(n_surr = n_surr, sig_level = sig_level, : For
#> 10 simultaneous tests at sig_level = 0.05, the empirical distribution of the
#> max-statistic may be unstable with n_surr = 249. Recommended n_surr is at least
#> 399.
print(res_ccf)
#>
#> === Bivariate Xi-Cross-Correlation (CCF) ===
#> Variables: X, Y
#> Time series length: 300
#> Max Lag: 5
#> Direction: both
#> Surrogates (MIAAFT): 249
#> Significance Level: 0.05 (FWER controlled)
#> ============================================
#> Top 5 Strongest Causal Pathways:
#>  Lead_Var Lag_Var Lag        Xi      CCF Global_Threshold Xi_Excess
#>         X       Y   2 0.6388298 0.123921       0.09151595 0.5473138
autoplot(res_ccf)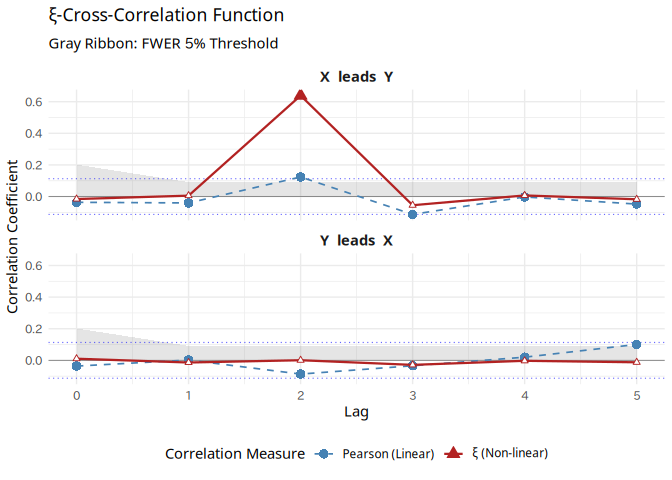
Analyze an entire system of variables at once.
### 3. Multivariate Network Matrix & Pathway Extraction

Z <- numeric(n)

# Z depends on the absolute value of Y at lag 1
# Because Y is centered, this creates a true V-shaped non-linear relationship
for (t in 2:n) {
  Z[t] <- abs(Y[t - 1]) + rnorm(1, sd = 0.2)
}
Z <- as.numeric(scale(Z))

df_system <- data.frame(X = X, Y = Y, Z = Z)

# Compute the multivariate Xi-correlogram matrix
res_matrix <- xi_matrix(df_system, max_lag = 3, n_surr = 499)

autoplot(res_matrix)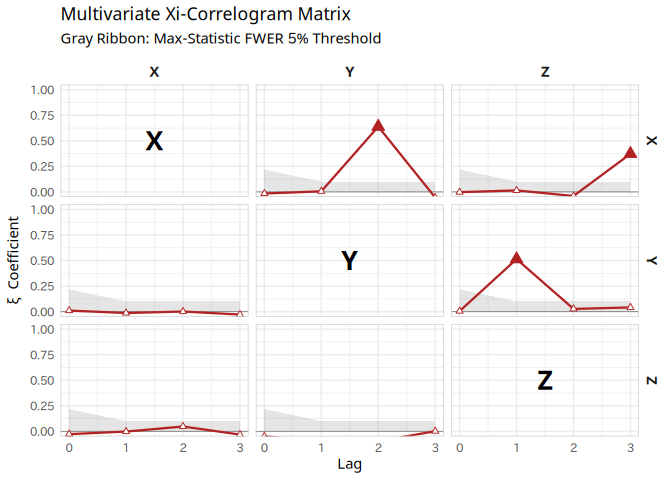
# Extract it for a detailed bivariate analysis with exact FWER re-evaluation!
ext_ccf <- extract_xi_ccf(res_matrix, var_x = "X", var_y = "Z", direction = "x_leads")
autoplot(ext_ccf)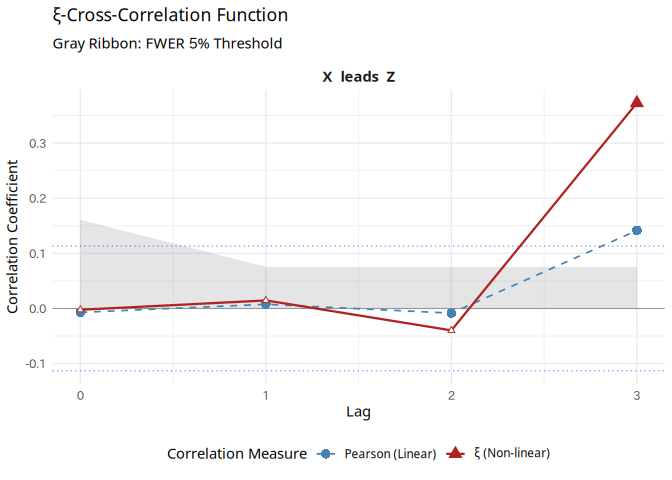
Extract time-varying non-linear dependencies. The output is a Tidy data frame, perfectly structured for custom EDA and visualization.
### 4. Rolling Analysis for Dynamic Relationships

library(future)
plan(multisession) # or multicore on Linux/macOS

rolling_res <- run_rolling_xi_ccf(
  x = X,
  y = Y,
  window_size = 50,
  step_size = 10,
  max_lag = 3,
  n_surr = 199
)

head(rolling_res)
#>   Window_ID Lead_Var Lag_Var Lag          Xi Global_Threshold Xi_Excess
#> 1         1        x       y   0 -0.03601441        0.2570228 0.0000000
#> 2         1        x       y   1 -0.04625000        0.2185806 0.0000000
#> 3         1        x       y   2  0.54798089        0.2185806 0.3294003
#> 4         1        x       y   3 -0.06657609        0.2185806 0.0000000
#> 5         1        y       x   0 -0.07803121        0.2570228 0.0000000
#> 6 1 y x 1 0.00125000 0.2185806 0.0000000The theoretical foundation and surrogate data methodologies implemented in this package are based on the following works:
This project is licensed under the MIT License - see the LICENSE file for details.
These binaries (installable software) and packages are in development.
They may not be fully stable and should be used with caution. We make no claims about them.
Health stats visible at Monitor.