The hardware and bandwidth for this mirror is donated by dogado GmbH, the Webhosting and Full Service-Cloud Provider. Check out our Wordpress Tutorial.
If you wish to report a bug, or if you are interested in having us mirror your free-software or open-source project, please feel free to contact us at mirror[@]dogado.de.
![]()
![]()
wheatmap builds complex heatmap figures by composing
panels using plain-English placement directives: TopOf,
RightOf, Beneath, LeftOf, and
variants. Each panel is a named object; subsequent panels reference
earlier ones by name to anchor their position. The result is a single
+-chained expression that reads like a description of the
layout.
From CRAN:
install.packages("wheatmap")From GitHub (development version):
# install.packages("devtools")
devtools::install_github("zwdzwd/wheatmap")A wheatmap figure is built by chaining objects with +.
The first object anchors the coordinate system at full canvas extent.
Every subsequent object receives a placement generator —
RightOf("name"), Beneath("name"), etc. — that
resolves its position relative to a named predecessor at draw time.
Core object types:
| Constructor | Purpose |
|---|---|
WHeatmap() |
Heatmap body (continuous or discrete color mapping) |
WColorBarH() / WColorBarV() |
Horizontal / vertical annotation bar |
WLegendV() |
Vertical color legend keyed to a named heatmap |
WCustomize() |
Global figure settings (margins, background, etc.) |
Color mapping is controlled by CMPar(), which wraps
palettes from RColorBrewer, colorspace, and the built-in
jet/bwr maps.
Each object can be given a name= for cross-referencing.
If omitted, wheatmap assigns one automatically; ly() shows
all current names.
library(wheatmap)

WHeatmap(matrix(1:12, nrow=2), cmp=CMPar(brewer.name='Greens'), name='a') +
  WHeatmap(matrix(1:6,  nrow=1), Beneath(pad=0.05), cmp=CMPar(brewer.name='Set2'), name='b') +
  WHeatmap(matrix(c(1:30,30:1), nrow=5), Beneath(pad=0.05), name='c', cmp=CMPar(cmap='jet')) +
  WHeatmap(matrix(1:24, nrow=4), RightOf('c'), name='d', cmp=CMPar(brewer.name='Set1')) +
  WLegendV('c', LeftOf('c',  pad=0.01), yticklabel.side='l') +
  WLegendV('b', RightOf('b', width=0.1)) +
  WLegendV('a', RightOf('a')) +
  WHeatmap(matrix(1:100, nrow=10), RightOf('d'), cmp=CMPar(brewer.name='RdYlGn')) +
  WColorBarH(matrix(5:1), TopOf(), cmp=CMPar(colorspace.name='diverge_hcl')) +
  WColorBarH(matrix(50:1), TopOf(), cmp=CMPar(colorspace.name='terrain_hcl')) +
  WColorBarH(matrix(1:8),  TopOf(), cmp=CMPar(colorspace.name='sequential_hcl')) +
  WColorBarH(matrix(1:8),  TopOf(), cmp=CMPar(brewer.name='YlOrRd'))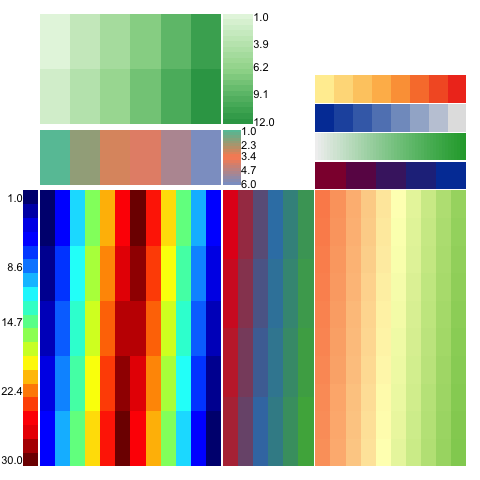
magrittr users can pipe with %>% and
add() instead of +:
library(magrittr)
WHeatmap(m, name='h1') %>% add(WColorBarV(row.data, LeftOf('h1'), name='c1'))print(g) wraps the figure in a gtable so that
outward-facing tick labels, colorbar labels, and legends are measured at
draw time and reserved as page margins rather than clipping at the
device edge. WCustomize(mar.*) values act as a minimum
floor; the measured extent wins when it is larger.
m <- matrix(rnorm(200), nrow=20)
rownames(m) <- sprintf("very_long_row_label_%02d", 1:20)
grp <- rep(c("groupA","groupB","groupC","groupD"), each=5)

g <- WHeatmap(m, name="main",
              yticklabels=TRUE, yticklabel.side='r', yticklabel.fontsize=7) +
     WColorBarH(grp, TopOf("main"), name="grp",
                label.use.data=TRUE, label.fontsize=8) +
     WCustomize()

pdf("output.pdf", width=5, height=5)
print(g)
dev.off()
Siblings placed via RightOf / LeftOf /
TopOf / Beneath are automatically shifted
outward by the measured label extent of their predecessor, so a legend
next to a labeled colorbar clears the labels rather than overlapping
them.
The internal grid.dendrogram() function is adapted from
the ComplexHeatmap package.
These binaries (installable software) and packages are in development.
They may not be fully stable and should be used with caution. We make no claims about them.
Health stats visible at Monitor.