

The hardware and bandwidth for this mirror is donated by dogado GmbH, the Webhosting and Full Service-Cloud Provider. Check out our Wordpress Tutorial.
If you wish to report a bug, or if you are interested in having us mirror your free-software or open-source project, please feel free to contact us at mirror[@]dogado.de.
wbCorr computes within- and between-cluster correlations
for clustered data, such as daily diary data with repeated measures
nested in persons, or data from dyads and teams.
In such data, two variables can be related in two ways:
These two correlations can differ in size and even in sign. A
correlation over all rows mixes them. wbCorr reports both
separately, with p-values, confidence intervals, and intraclass
correlations (ICCs).
If you use wbCorr, please cite it as:
Küng, P. (2026). wbCorr: Bivariate Within- and Between-Cluster Correlations. https://doi.org/10.5281/zenodo.20357592
Install the released version from CRAN:
install.packages("wbCorr")Install the development version:
install.packages(
  "wbCorr",
  repos = c(
    "https://pascal-kueng.r-universe.dev",
    "https://cloud.r-project.org"
  )
)The package includes simulated daily diary data. 100 participants
reported three variables (var1, var2, and
var3) on 50 days. The data were simulated so that all
within-person correlations are positive and all between-person
correlations are negative.
library(wbCorr)

data("simdat_intensive_longitudinal")
diary <- simdat_intensive_longitudinal[c("participantID", "var1", "var2", "var3")]

correlations <- wbCorr(diary, cluster = "participantID")
summary() shows both levels in one matrix. Within-person
correlations are above the diagonal, between-person correlations below
it, and ICCs on the diagonal.
summary(correlations, "wb")
#> $merged_wb
#>          var1    var2    var3
#> var1   [0.51] 0.12*** 0.79***
#> var2 -0.60***  [0.49] 0.29***
#> var3   -0.24*   -0.04  [0.49]
#>
#> $note
#> [1] "***p < 0.001, **p < 0.01, *p < 0.05"
For var1 and var2, the two levels point in
opposite directions. On days when participants report a higher
var1 than usual, they also report a slightly higher
var2 (r = 0.12). But participants with a higher average
var1 have a lower average var2 (r =
-0.60).
get_table() returns the full results with test
statistics, degrees of freedom, confidence intervals, and p-values:
get_table(correlations)
#> $within
#>   Parameter1 Parameter2 pearson's r t-statistic   df       95% CI         p
#> 1       var1       var2        0.12        8.53 4899 [0.09, 0.15] < .001***
#> 2       var1       var3        0.79       89.04 4899 [0.78, 0.80] < .001***
#> 3       var2       var3        0.29       21.50 4899 [0.27, 0.32] < .001***
#>
#> $between
#>   Parameter1 Parameter2 pearson's r t-statistic df         95% CI         p
#> 1       var1       var2       -0.60       -7.46 98 [-0.71, -0.46] < .001***
#> 2       var1       var3       -0.24       -2.43 98 [-0.42, -0.04]    0.017*
#> 3       var2       var3       -0.04       -0.44 98  [-0.24, 0.15]     0.659
plot() shows the data behind each correlation. The lower
panels show scatterplots with a regression line and outliers in red. The
upper panels show the correlation and its significance stars.
plot(correlations, "within")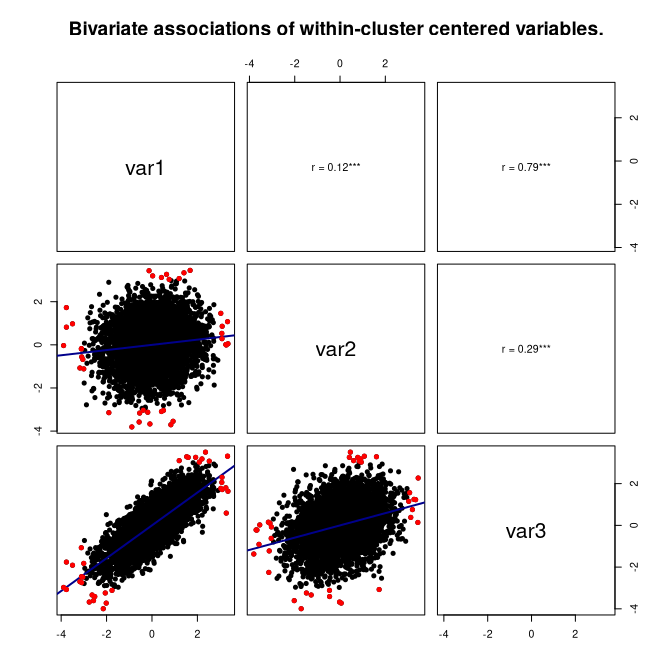
plot(correlations, "between")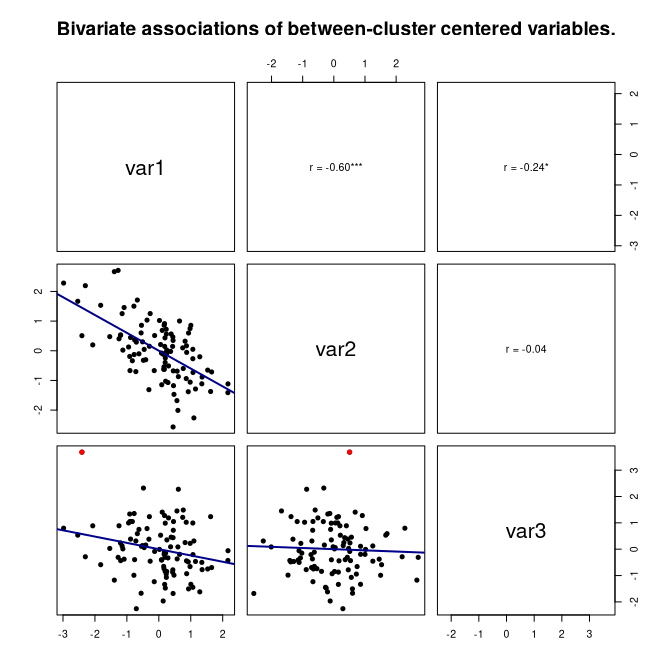
| Function | Description |
|---|---|
wbCorr() |
Computes all correlations and ICCs. |
summary(), get_matrix() |
Correlation matrices with significance stars: within
("w"), between ("b"), or both in one matrix
("wb", "bw"). |
get_table() |
Full tables with test statistics, confidence intervals, and p-values. |
get_ICC() |
ICC of each variable. |
plot() |
Scatterplot matrix of the within- or between-cluster parts. |
to_excel() |
Saves tables or matrices to an Excel file. |
| Argument | Options |
|---|---|
method |
"pearson" (default), "spearman", or
"auto" (Spearman for ordered factors, Pearson
otherwise). |
inference |
"analytic" (default), "cluster_bootstrap",
or "none" (correlations only). |
between_weighting |
"equal_clusters" (default) weights each cluster
equally. "cluster_size" weights each cluster by its number
of observations of both variables. |
confidence_level |
Level of the confidence intervals (default: 0.95). |
nboot |
Number of bootstrap samples (default: 1000). |
For example, the cluster bootstrap resamples whole persons, so its confidence intervals account for the dependence within persons:
set.seed(2026)
bootstrapped <- wbCorr(diary, cluster = "participantID", inference = "cluster_bootstrap")
get_table(bootstrapped, "between")
#> $between
#>   Parameter1 Parameter2 pearson's r      BC 95% CI bootstrap p
#> 1       var1       var2       -0.60 [-0.70, -0.47]   < .001***
#> 2       var1       var3       -0.24 [-0.42, -0.04]      0.018*
#> 3 var2 var3 -0.04 [-0.22, 0.12] 0.610psych::statsBy().Use numeric or binary variables. wbCorr converts ordered
factors to their level numbers; analyze them with
method = "auto" or "spearman". Dummy-code
nominal variables before use.
See ?wbCorr for details.
To cite the version you used, run:
citation("wbCorr")BibTeX (without version):
@Manual{wbCorr,
  title = {wbCorr: Bivariate Within- and Between-Cluster Correlations},
  author = {Pascal Küng},
  organization = {University of Zurich},
  year = {2026},
  url = {https://pascal-kueng.github.io/wbCorr/},
  doi = {10.5281/zenodo.20357592},
}Please report bugs or suggest improvements through GitHub Issues.
These binaries (installable software) and packages are in development.
They may not be fully stable and should be used with caution. We make no claims about them.
Health stats visible at Monitor.