The hardware and bandwidth for this mirror is donated by dogado GmbH, the Webhosting and Full Service-Cloud Provider. Check out our Wordpress Tutorial.
If you wish to report a bug, or if you are interested in having us mirror your free-software or open-source project, please feel free to contact us at mirror[@]dogado.de.
The vennLasso package provides methods for hierarchical
variable selection for models with covariate effects stratified by
multiple binary factors.
The vennLasso package can be installed from CRAN
using:
install.packages("vennLasso")The development version can be installed using the devtools package:
devtools::install_github("jaredhuling/vennLasso")or by cloning and building.
Load the vennLasso package:
library(vennLasso)Access help file for the main fitting function
vennLasso() by running:
?vennLassoHelp file for cross validation function cv.vennLasso()
can be accessed by running:
?cv.vennLassoSimulate heterogeneous data:
set.seed(100)
dat.sim <- genHierSparseData(ncats = 3,  # number of stratifying factors
                             nvars = 25, # number of variables
                             nobs = 150, # number of observations per strata
                             nobs.test = 10000,
                             hier.sparsity.param = 0.5,
                             prop.zero.vars = 0.75, # proportion of variables
                                                   # zero for all strata
                             snr = 0.5,  # signal-to-noise ratio
                             family = "gaussian")

# design matrices
x        <- dat.sim$x
x.test   <- dat.sim$x.test

# response vectors
y        <- dat.sim$y
y.test   <- dat.sim$y.test

# binary stratifying factors
grp      <- dat.sim$group.ind
grp.test <- dat.sim$group.ind.test
Inspect the populations for each strata:
plotVenn(grp)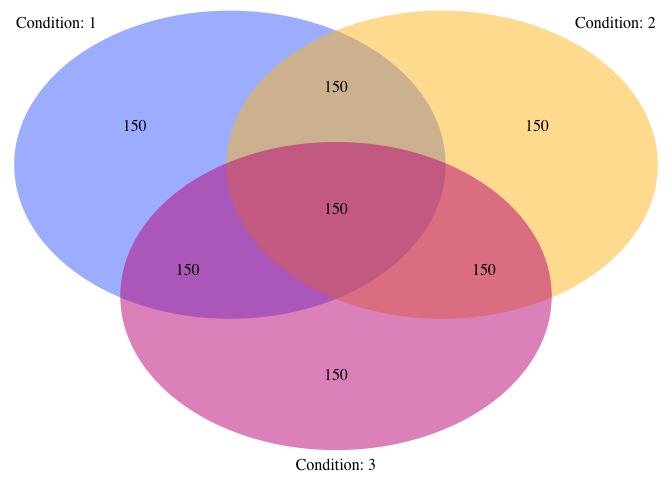
Fit vennLasso model with tuning parameter selected with 5-fold cross validation:
fit.adapt <- cv.vennLasso(x, y,
                          grp,
                          adaptive.lasso = TRUE,
                          nlambda        = 50,
                          family         = "gaussian",
                          standardize    = FALSE,
                          intercept      = TRUE,
                          nfolds         = 5)
Plot selected variables for each strata (not run):
library(igraph)##
## Attaching package: 'igraph'## The following objects are masked from 'package:stats':
##
## decompose, spectrum## The following object is masked from 'package:base':
##
## unionplotSelections(fit.adapt)Predict response for test data:
preds.vl <- predict(fit.adapt, x.test, grp.test, s = "lambda.min",
                    type = 'response')
Evaluate mean squared error:
mean((y.test - preds.vl) ^ 2)## [1] 0.6837243mean((y.test - mean(y.test)) ^ 2)## [1] 1.011026Compare with naive model with all interactions between covariates and stratifying binary factors:
df.x <- data.frame(y = y, x = x, grp = grp)
df.x.test <- data.frame(x = x.test, grp = grp.test)

# create formula for interactions between factors and covariates
form <- paste("y ~ (", paste(paste0("x.", 1:ncol(x)), collapse = "+"), ")*(grp.1*grp.2*grp.3)" )
Fit linear model and generate predictions for test set:
lmf <- lm(as.formula(form), data = df.x)

preds.lm <- predict(lmf, df.x.test)
Evaluate mean squared error:
mean((y.test - preds.lm) ^ 2)## [1] 0.8056107mean((y.test - preds.vl) ^ 2)## [1] 0.6837243These binaries (installable software) and packages are in development.
They may not be fully stable and should be used with caution. We make no claims about them.
Health stats visible at Monitor.