The hardware and bandwidth for this mirror is donated by dogado GmbH, the Webhosting and Full Service-Cloud Provider. Check out our Wordpress Tutorial.
If you wish to report a bug, or if you are interested in having us mirror your free-software or open-source project, please feel free to contact us at mirror[@]dogado.de.
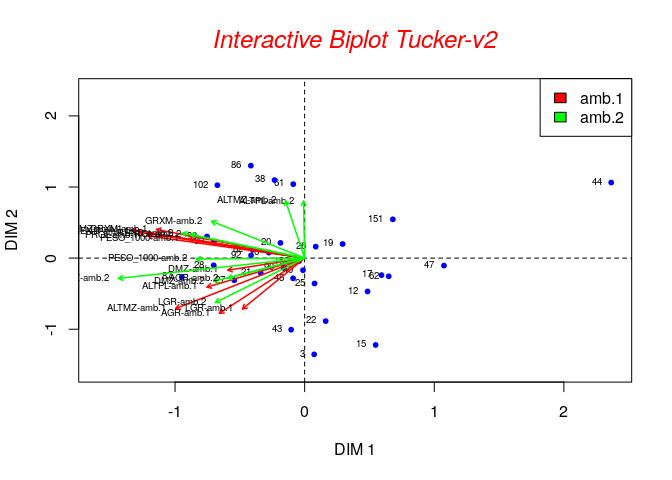
This package performs Three-Mode Principal Components using Tuckers Models and plot interactive Biplot.Some experiment design generated three-way or three-mode data, repeated observations of a set of attributes for a set of individuals in different conditions. The information was displayed in a three-dimensional array, and the structure of the data was explored using Three-Mode Principal Component Analysis, the Tucker-2 Model.
You can install tuckerR.mmgg from github with:
# install.packages("devtools")
devtools::install_github("gusart/tuckerR_mmgg")The most important contribution of this package are the interactive
biplot graphics and the application of the diffit()
function to find the best combination of components to retain.
This is a basic example which shows you how to solve a common problem:
library(tuckerR.mmgg)
#>
#> Attaching package: 'tuckerR.mmgg'
#> The following object is masked from 'package:graphics':
#>
#>     plot
data(maize_pop)
output <- tucker2R(maize_pop,amb=2,stand=TRUE,nc1=3,nc2=3)output$matrizG
#> [,1] [,2] [,3] [,4] [,5] [,6]
#> [1,] 10.260719 1.847900 3.553432 8.380775 3.021522 -0.5999851
#> [2,] -2.014825 3.989558 3.306571 -1.322206 3.332721 -4.2685767
#> [3,] -1.290695 3.355101 -3.429868 1.325232 3.341179 3.2866310
#> [,1] [,2] [,3] [,4] [,5] [,6]
#> [1,] 10.260719 1.847900 3.553432 8.380775 3.021522 -0.5999851
#> [2,] -2.014825 3.989558 3.306571 -1.322206 3.332721 -4.2685767
#> [3,] -1.290695 3.355101 -3.429868 1.325232 3.341179 3.2866310plot(output) 
These binaries (installable software) and packages are in development.
They may not be fully stable and should be used with caution. We make no claims about them.
Health stats visible at Monitor.