The hardware and bandwidth for this mirror is donated by dogado GmbH, the Webhosting and Full Service-Cloud Provider. Check out our Wordpress Tutorial.
If you wish to report a bug, or if you are interested in having us mirror your free-software or open-source project, please feel free to contact us at mirror[@]dogado.de.
trendseries provides a unified interface to extract
trends, cycles, and seasonal components from time series. Most filtering
methods in R are designed for ts objects, but datasets
typically come in a data.frame format with a date column,
which makes applying filters cumbersome. trendseries
bridges this gap: augment_trends(),
decompose_series(), deseason_series(), and
detrend_series() all work directly on
data.frame/tibble objects, while
extract_trends() provides the same methods for
ts/xts/zoo objects when you need
to stay in native time-series format.
trendseries is available on CRAN
install.packages("trendseries")You can install the newest version of trendseries from R-Universe.
install.packages(
  'trendseries',
  repos = c(
    'https://viniciusoike.r-universe.dev',
    'https://cloud.r-project.org'
  )
)Six core functions cover
data.frame/tibble/data.table
workflows.
augment_trends(): adds trend columns
to the original dataset.augment_rolling(): add rolling window
trend columns to the original dataset.decompose_series(): splits a series
into trend, seasonal, and remainder components.deseason_series(): wraps
decompose_series() to return a seasonally adjusted
series.detrend_series(): wraps
augment_trends() to return the deviation from trend (the
cycle).index_series(): rescales one or more
series to a common base period and value.Some functions like augment_trends() also have a
ts/xts/zoo-native counterpart via
extract_trends(), for workflows that stay
in native time-series format.
augment_trends() and detrend_series() also
accept tsibbles with Date, yearmonth, or
yearquarter indices. They use the tsibble index and key as
defaults and return a tsibble. The tsibble package is
optional.
The example below computes three filters (HP, STL, and moving
average) on a quarterly index of construction activity.
augment_trends() detects the frequency of the data and
picks conventional defaults for the HP filter.
library(trendseries)
library(ggplot2)
data(gdp_construction)
# Computes multiple trends at once
series <- gdp_construction |>
  # Automatically detects frequency
  # Trends are added as new columns to the original dataset
  augment_trends(
    value_col = "index",
    methods = c("hp", "stl", "ma")
  )
#> Auto-detected quarterly (4 obs/year)

series
#> # A tibble: 124 × 5
#>    date       index trend_hp trend_stl trend_ma
#>    <date>     <dbl>    <dbl>     <dbl>    <dbl>
#>  1 1995-01-01 100       101.     102.      NA
#>  2 1995-04-01 100       101.     101.      NA
#>  3 1995-07-01 100       102.     100.      99.7
#>  4 1995-10-01 100       103.      99.4     99.6
#>  5 1996-01-01  97.8     103.     101.     101.
#>  6 1996-04-01 101.      104.     102.     102.
#>  7 1996-07-01 107.      104.     103.     103.
#>  8 1996-10-01 103.      105.     104.     104.
#>  9 1997-01-01 101.      106.     106.     106.
#> 10 1997-04-01 108.      106.     109.     109.
#> # ℹ 114 more rows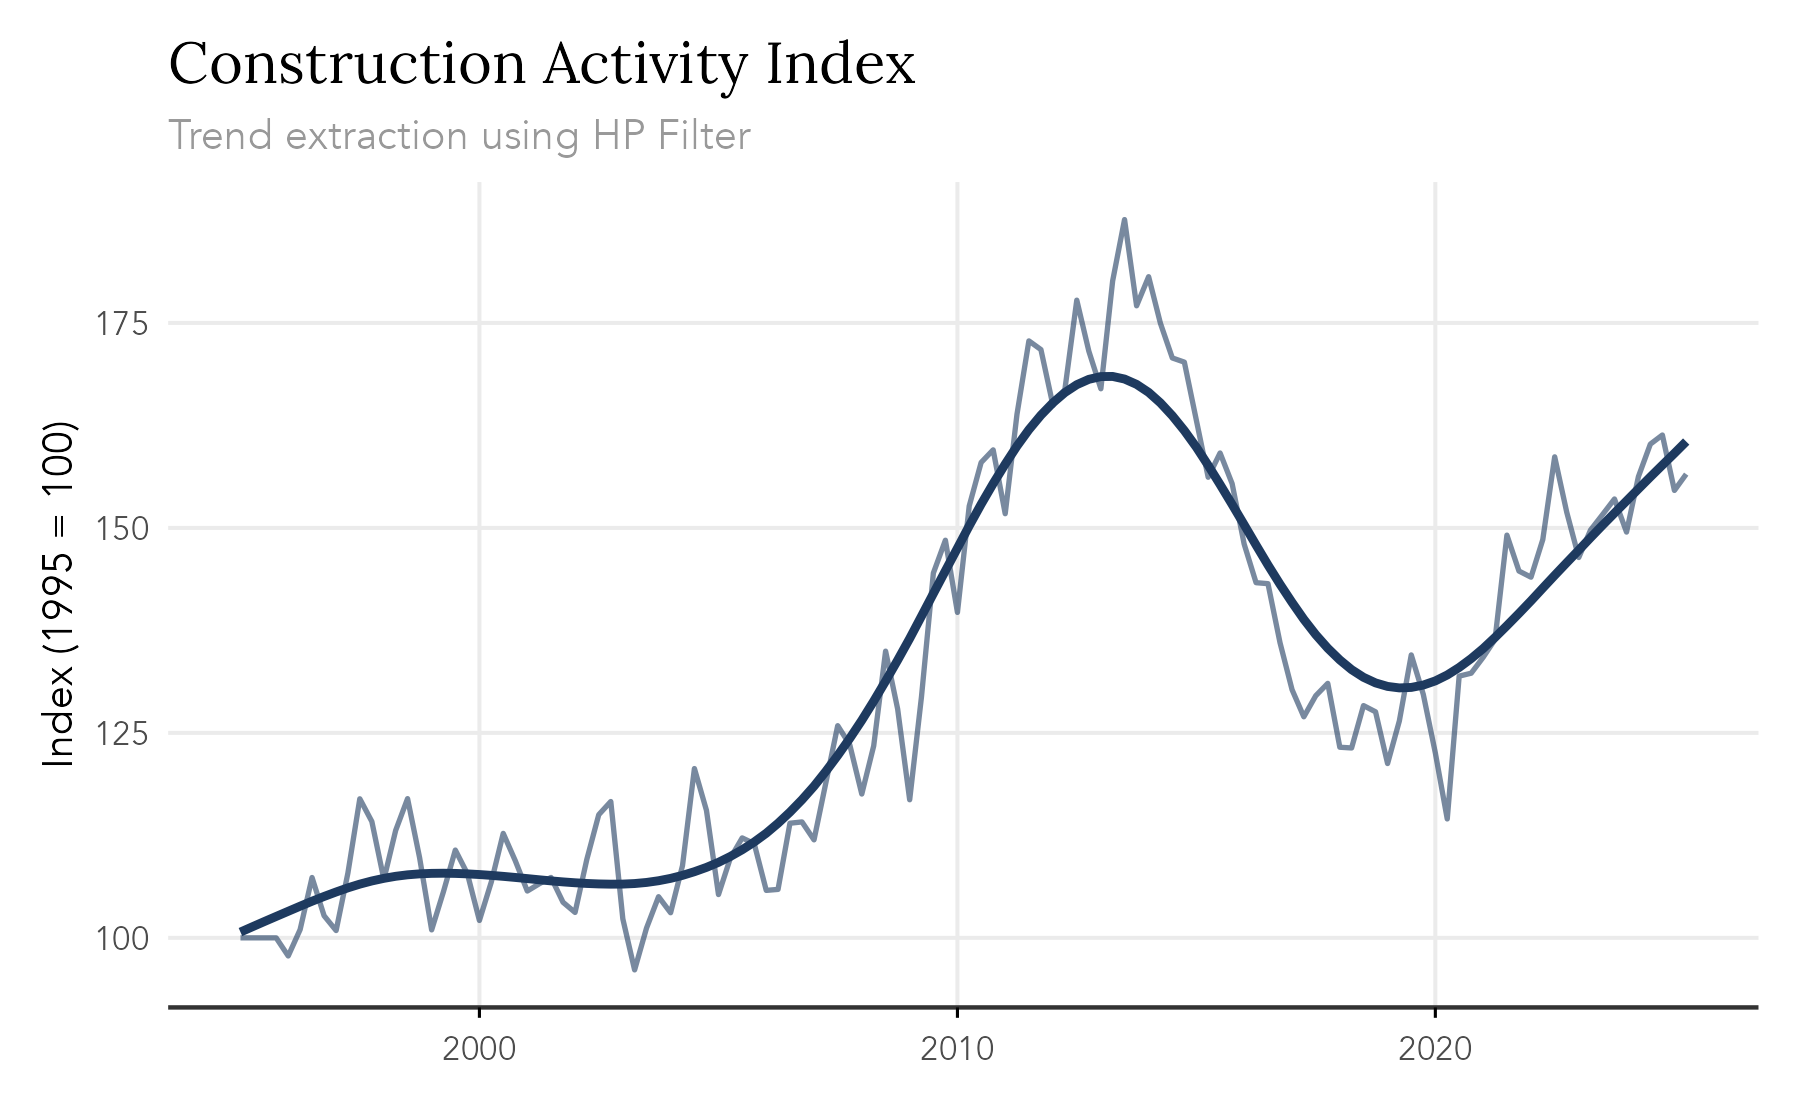
An equivalent extract_trends() function is also
available for ts objects.
stl_trend <- extract_trends(AirPassengers, methods = "stl")
#> Computing STL trend with s.window = periodic
plot.ts(AirPassengers)
lines(stl_trend, col = "#C53030")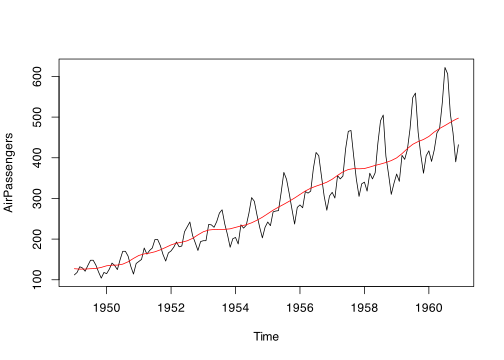
The Trend Extraction Methods article describes each one: when to use it and which parameters it takes.
| Method | Description |
|---|---|
hp |
Hodrick-Prescott filter |
bn |
Beveridge-Nelson decomposition |
ucm |
Unobserved components model |
hamilton |
Hamilton regression filter |
bk |
Baxter-King bandpass filter |
cf |
Christiano-Fitzgerald bandpass filter |
ma |
Simple moving average |
spencer |
Spencer’s 15-term moving average |
ewma |
Exponentially weighted moving average |
wma |
Weighted moving average |
triangular |
Triangular moving average |
median |
Median filter |
gaussian |
Gaussian-weighted moving average |
henderson |
Henderson moving average |
stl |
Seasonal-trend decomposition via Loess |
loess |
Local polynomial regression (loess) |
spline |
Smoothing splines |
poly |
Polynomial trend |
kernel |
Kernel smoother |
kalman |
Kalman filter/smoother |
To learn more about the package be sure to visit the webiste
The vignettes below cover each function in detail.
The package includes daily Arabica and Robusta coffee price indicators from the Centro de Estudos Avançados em Economia Aplicada (CEPEA), Escola Superior de Agricultura Luiz de Queiroz (ESALQ), Universidade de São Paulo (USP). See the Arabica and Robusta source series, and the Arabica methodology and Robusta methodology.
CEPEA identifies its coffee data as available under the Creative Commons
Attribution-NonCommercial 4.0 International license. That license
applies to the CEPEA-derived data; the package code is licensed under
MIT. The bundled data are an adapted version: usd_2022 is
calculated from the source dollar price using U.S. inflation data, and
trend_ma is a 22-observation moving-average column. The
current bundled release contains only missing values in
trend_ma.
Suggested attribution:
Centro de Estudos Avançados em Economia Aplicada (CEPEA), Escola Superior de Agricultura Luiz de Queiroz (ESALQ), Universidade de São Paulo (USP), CEPEA/ESALQ coffee price indicators, CC BY-NC 4.0; adapted in
trendseries. This attribution does not imply CEPEA endorses the package.
trendseries includes transit_london_monthly
and transit_london_avgs, which are derived from Transport
for London’s (TfL) daily Journeys files. The source
covers Bus and Tube journeys only; it is distinct from TfL’s
station-footfall files. The bundled snapshot contains daily records from
2019-01-01 through 2025-12-27. TfL can revise historical rows when the
source files are refreshed, so these datasets should be treated as a
versioned snapshot rather than a live feed.
transit_london_monthly sums the reported daily journey
counts by calendar month. transit_london_avgs calculates
the mean daily count by month, mode, and UK business-day status. The
counts are recorded ticketing activity, not an absolute measure of
passenger numbers or journeys made; they exclude people who did not tap
in or out and are approximate, rounded to the nearest thousand.
Source and methodology: TfL Network demand data, the Network Demand Dashboard, and TfL’s Transport Data Service terms.
Required attribution:
Powered by TfL Open Data
The package is not affiliated with or endorsed by TfL.
The package also includes a processed subset of the ONS Retail Sales Index, specifically Table 3M’s non-seasonally adjusted chained volume indices for selected retail sectors in Great Britain. See the ONS Retail Sales Index methodology for details on coverage and methods. Contains public sector information licensed under the Open Government Licence v3.0, except where otherwise stated.
These binaries (installable software) and packages are in development.
They may not be fully stable and should be used with caution. We make no claims about them.
Health stats visible at Monitor.