The hardware and bandwidth for this mirror is donated by dogado GmbH, the Webhosting and Full Service-Cloud Provider. Check out our Wordpress Tutorial.
If you wish to report a bug, or if you are interested in having us mirror your free-software or open-source project, please feel free to contact us at mirror[@]dogado.de.
This is a small package to provide consistent tick marks for plotting ‘ggplot2’ figures. It provides breaks and labels for ‘ggplot2’ without requiring ‘ggplot2’ to be installed.
You can install the development version of tickr from
GitHub:
# install.packages("remotes")
remotes::install_github("BenWilliams-NOAA/tickr")library(tickr)
library(ggplot2)
library(dplyr)
#>
#> Attaching package: 'dplyr'
#> The following objects are masked from 'package:stats':
#>
#> filter, lag
#> The following objects are masked from 'package:base':
#>
#> intersect, setdiff, setequal, unionSome basic examples of how to use the tickr package.
# Create a data.frame
df <- data.frame(year = 2000:2020,
spawning_biomass = rnorm(21,100, 0.25))
# explore tickr output
tickr(df, var=year)
#> breaks labels
#> 1 2000 2000
#> 2 2001
#> 3 2002
#> 4 2003
#> 5 2004
#> 6 2005 2005
#> 7 2006
#> 8 2007
#> 9 2008
#> 10 2009
#> 11 2010 2010
#> 12 2011
#> 13 2012
#> 14 2013
#> 15 2014
#> 16 2015 2015
#> 17 2016
#> 18 2017
#> 19 2018
#> 20 2019
#> 21 2020 2020
tickr(df, var=year, by=2)
#> breaks labels
#> 1 2000 2000
#> 2 2001
#> 3 2002 2002
#> 4 2003
#> 5 2004 2004
#> 6 2005
#> 7 2006 2006
#> 8 2007
#> 9 2008 2008
#> 10 2009
#> 11 2010 2010
#> 12 2011
#> 13 2012 2012
#> 14 2013
#> 15 2014 2014
#> 16 2015
#> 17 2016 2016
#> 18 2017
#> 19 2018 2018
#> 20 2019
#> 21 2020 2020
tickr(df, var=year, by=5, var_min = 1998, var_max = 2024, lab_start = 1998, lab_end = 2017)
#> breaks labels
#> 1 1998 1998
#> 2 1999
#> 3 2000
#> 4 2001
#> 5 2002
#> 6 2003 2003
#> 7 2004
#> 8 2005
#> 9 2006
#> 10 2007
#> 11 2008 2008
#> 12 2009
#> 13 2010
#> 14 2011
#> 15 2012
#> 16 2013 2013
#> 17 2014
#> 18 2015
#> 19 2016
#> 20 2017
#> 21 2018
#> 22 2019
#> 23 2020
#> 24 2021
#> 25 2022
#> 26 2023
#> 27 2024
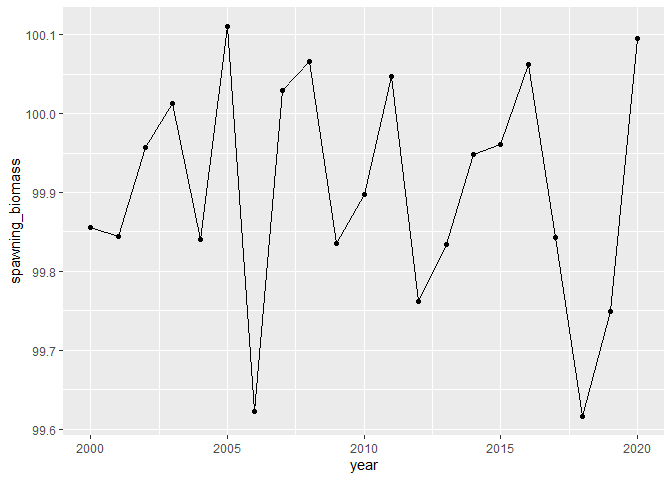
# explore plotting options
# default ggplot
ggplot(df, aes(year, spawning_biomass)) +
geom_line() +
geom_point()
# a tick mark for every year
ggplot(df, aes(year, spawning_biomass)) +
  geom_line() +
  geom_point() +
  scale_x_tickr(data=df, var=year)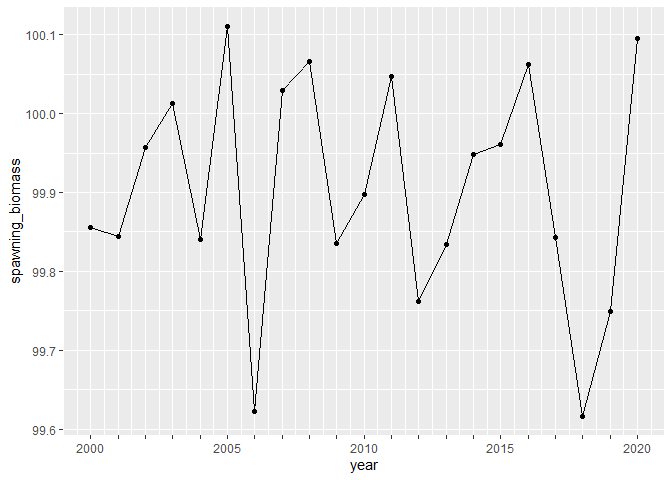
# a tick mark for every year & label every 2nd year
ggplot(df, aes(year, spawning_biomass)) +
  geom_line() +
  geom_point() +
  scale_x_tickr(data=df, var=year, by = 2)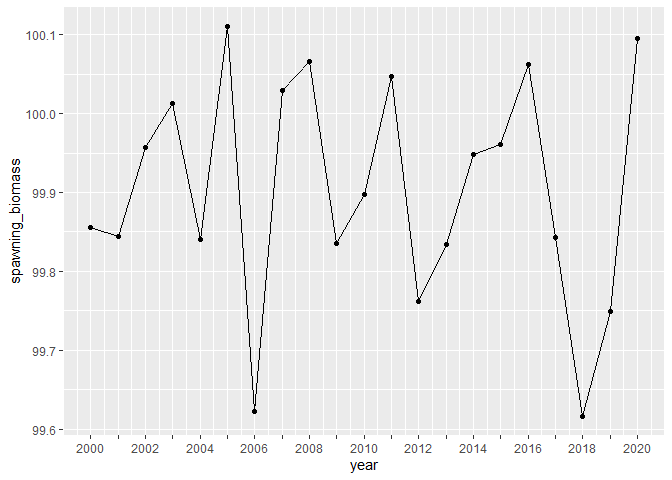
# determine the years that are labeled
ggplot(df, aes(year, spawning_biomass)) +
  geom_line() +
  geom_point() +
  scale_x_tickr(data=df, var=year, by = 5,
                var_min = 1997,
                var_max = 2024,
lab_start = 1997) 
# determine the years that are labeled
ggplot(df, aes(year, spawning_biomass)) +
  geom_line() +
  geom_point() +
  scale_x_tickr(data=df, var=year, by = 2,
                var_min = 2010,
                lab_start = 2010)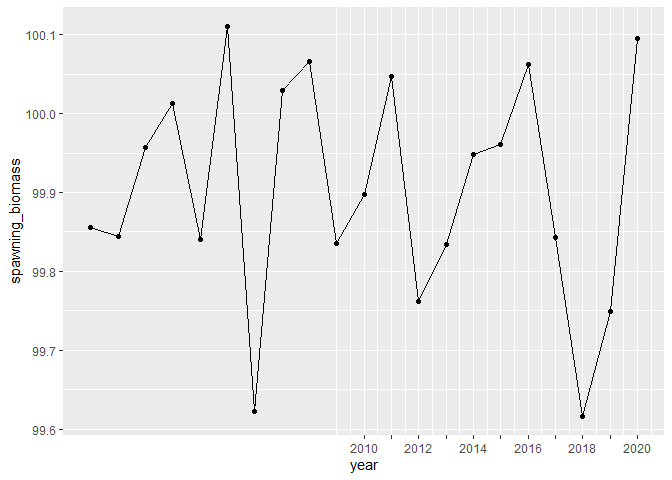
# show future years
ggplot(df, aes(year, spawning_biomass)) +
  geom_line() +
  geom_point() +
  scale_x_tickr(data=df, var=year, by = 5,
                var_min = 2015,
                var_max = 2026,
                lab_start = 2015,
                lab_end = 2026) +
expand_limits(x = c(1998, 2026)) 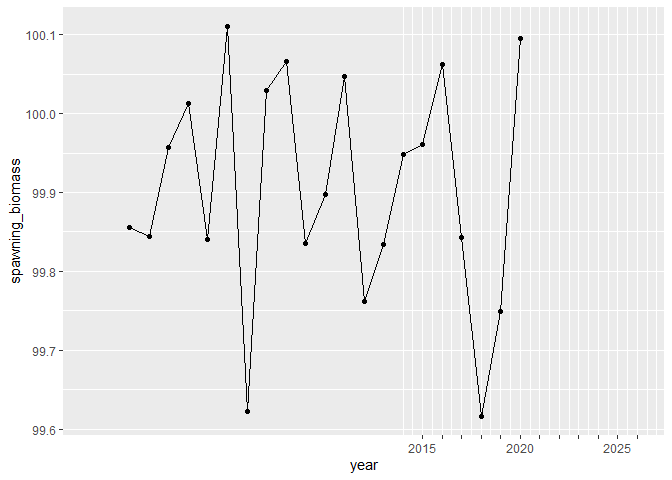
The same general approach is available for y axes as well.
df <- expand.grid(age = 1:10,
                 year = 2000:2009) %>%
  dplyr::mutate(value = rnorm(100, 1, 1))

df %>%
  ggplot(aes(year, age, size=value)) +
  geom_point() +
  scale_size_area() +
  scale_x_tickr(data=df, var=year, by=2, var_max = 2012, lab_end = 2012) +
  scale_y_tickr(data=df, var=age, by=2) +
  expand_limits(y=0, x=2012)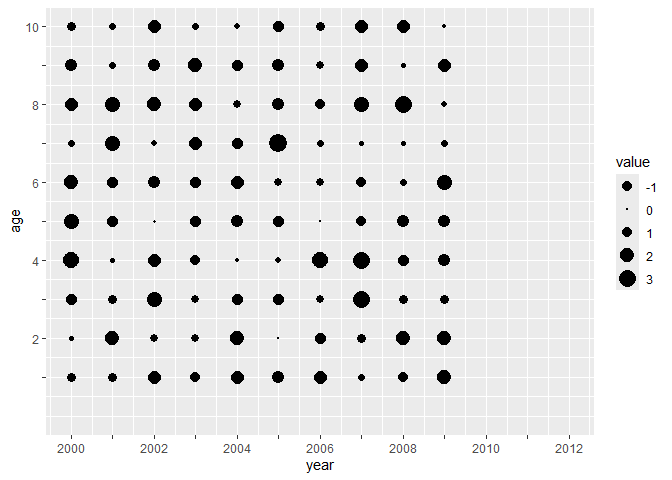
These binaries (installable software) and packages are in development.
They may not be fully stable and should be used with caution. We make no claims about them.
Health stats visible at Monitor.