The hardware and bandwidth for this mirror is donated by dogado GmbH, the Webhosting and Full Service-Cloud Provider. Check out our Wordpress Tutorial.
If you wish to report a bug, or if you are interested in having us mirror your free-software or open-source project, please feel free to contact us at mirror[@]dogado.de.
![]()
![]()

Also called “relief contours method”, “illuminated contour method” or “shaded contour lines method”, the Tanaka method1 enhances the representation of topography on a map by using shaded contour lines. The result is a 3D-like map.
This package is a simplified implementation of the Tanaka method, north-west white contours represent illuminated topography and south-east black contours represent shaded topography. Even if the results are quite satisfactory, a more refined method could be used based on the Kennelly and Kimerling’s paper2.
tanaka is a small package with two functions:
tanaka() uses a terra object and displays
the map directly;tanaka_contour() builds the isopleth polygon
layer.The contour lines creation relies on mapiso,
spatial manipulation and display rely on sf.
install.packages("tanaka")require(remotes)
install_github("riatelab/tanaka")library(tanaka)
library(terra)
ras <- rast(system.file("tif/elev.tif", package = "tanaka"))
tanaka(ras, breaks = seq(80,400,20),
legend.pos = "topright", legend.title = "Elevation\n(meters)")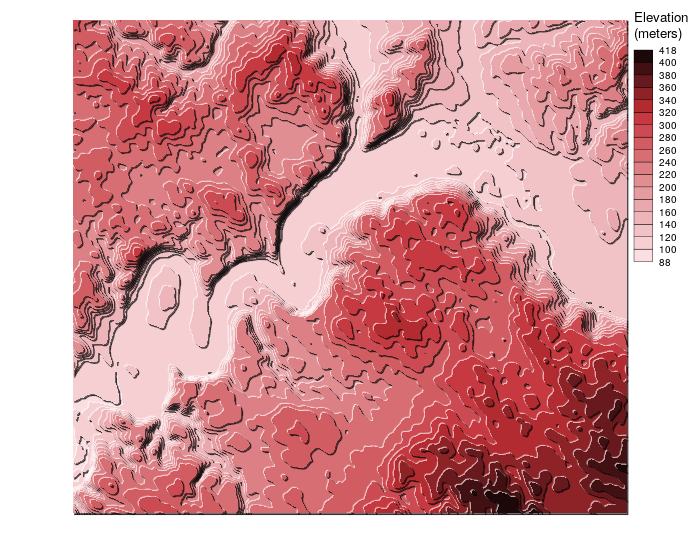
elevatr.library(tanaka)
library(elevatr)
library(terra)
# use elevatr to get elevation data
ras <- get_elev_raster(locations = data.frame(x = c(6.7, 7), y = c(45.8,46)),
z = 10, prj = "EPSG:4326", clip = "locations")
ras <- rast(ras)
# custom color palette
cols <- c("#F7E1C6", "#EED4C1", "#E5C9BE", "#DCBEBA", "#D3B3B6", "#CAA8B3",
"#C19CAF", "#B790AB", "#AC81A7", "#A073A1", "#95639D", "#885497",
"#7C4692", "#6B3D86", "#573775", "#433266", "#2F2C56", "#1B2847")
# display the map
tanaka(ras, breaks = seq(500,4800,250), col = cols)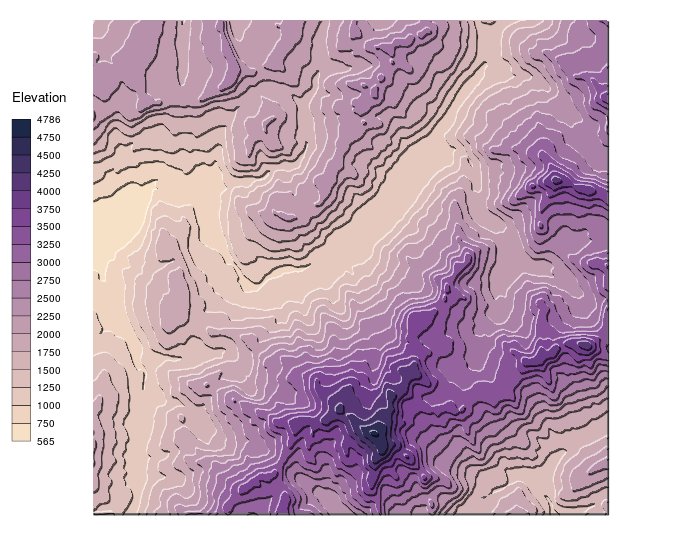
library(terra)
library(sf)
library(tanaka)
library(mapsf)
# Download
tempzip <- tempfile()
tempfolder <- tempdir()
data_url <- paste0("http://cidportal.jrc.ec.europa.eu/ftp/jrc-opendata/GHSL/",
                   "GHS_POP_GPW4_GLOBE_R2015A/GHS_POP_GPW42015_GLOBE_R2015A_54009_1k/",
                   "V1-0/GHS_POP_GPW42015_GLOBE_R2015A_54009_1k_v1_0.zip")
download.file(data_url, tempzip)
unzip(tempzip, exdir = tempfolder)
# Import
pop2015 <- rast(paste0(tempfolder,
                       "/GHS_POP_GPW42015_GLOBE_R2015A_54009_1k_v1_0/",
                       "GHS_POP_GPW42015_GLOBE_R2015A_54009_1k_v1_0.tif"))
# Mask raster
center <- st_as_sf(data.frame(x=425483.8, y=5608290),
                   coords=(c("x","y")),
                   crs = st_crs(pop2015))
center <- st_buffer(center, dist = 800000)
ras <- crop(pop2015, st_bbox(center)[c(1,3,2,4)])
# Smooth values
mat <- focalMat(x = ras, d = c(10000), type = "Gauss")
rassmooth <- focal(x = ras, w = mat, fun = sum, na.rm = TRUE)
# Map
bks <- c(0,25,50,100,250,500,750,1000,1750,2500,5000, 7500,10000)
mf_export(x = center, filename = "circle.png", width = 800, res = 100)
tanaka(x = rassmooth,
       breaks = bks,
       mask = center,
       col = hcl.colors(n = 12, palette = "Inferno"),
       shift = 2500,
       add = TRUE,
       legend.pos = "topleft",
       legend.title = "Inhabitants\nper km2")
mf_map(center, add = TRUE, border = "white", col = NA, lwd = 6)
mf_title(txt = "Smoothed Population Density")
mf_credits(paste0("T. Giraud, 2022\n",
                  "Data : European Commission, Joint Research Centre (JRC); ",
                  "Columbia University, CIESIN (2015): GHS population grid, ",
                  "derived from GPW4."))
text(-250000 ,6420000, "Gaussian filter, sigma = 10km",
     adj = 0, font = 3, cex = .8, xpd = TRUE )
dev.off()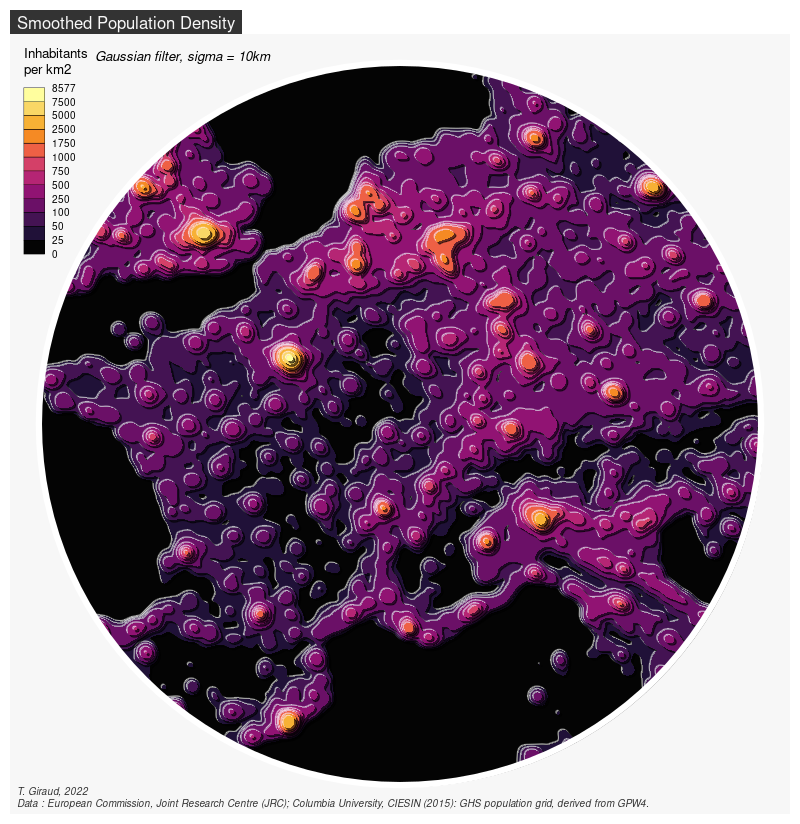
The metR
package allows to draw Tanaka
contours with ggplot2.
1: Tanaka, K. (1950). The relief contour method of
representing topography on maps. Geographical Review, 40(3),
444-456.
2: Kennelly, P., & Kimerling, A. J. (2001).
Modifications of Tanaka’s illuminated contour method. Cartography
and Geographic Information Science, 28(2), 111-123.
These binaries (installable software) and packages are in development.
They may not be fully stable and should be used with caution. We make no claims about them.
Health stats visible at Monitor.