The hardware and bandwidth for this mirror is donated by dogado GmbH, the Webhosting and Full Service-Cloud Provider. Check out our Wordpress Tutorial.
If you wish to report a bug, or if you are interested in having us mirror your free-software or open-source project, please feel free to contact us at mirror[@]dogado.de.
![]()
![]()
![]()
{talib} is an R
package for technical analysis, candlestick pattern recognition, and
interactive financial charting—built on the TA-Lib C library. It
provides 67 technical indicators, 61 candlestick patterns, and a
composable charting system powered by {plotly} and {ggplot2}. All indicator
computations are implemented in C via .Call() for minimal
overhead.
Alongside {TTR}, {talib} adds candlestick pattern recognition and interactive charts to the R technical analysis ecosystem.
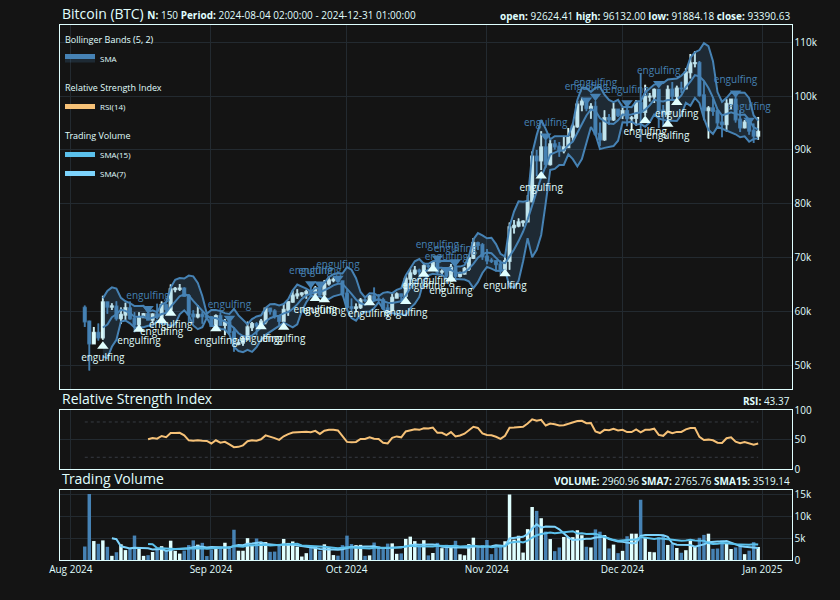
{
    ## create a candlestick chart
    talib::chart(BTC, title = "Bitcoin (BTC)")

    ## overlay Bollinger Bands on
    ## the price panel
    talib::indicator(talib::bollinger_bands)

    ## mark Engulfing candlestick
    ## patterns on the chart
    talib::indicator(talib::engulfing, data = BTC)

    ## add RSI and volume as
    ## separate sub-panels
    talib::indicator(talib::RSI)
    talib::indicator(talib::trading_volume)
}
Every indicator follows the same interface: pass an OHLCV
data.frame or matrix and get the same type
back. The return type always matches the input.
## compute Bollinger Bands
## on BTC OHLCV data
tail(
    talib::bollinger_bands(BTC)
)
#>                     UpperBand MiddleBand LowerBand
#> 2024-12-26 01:00:00 100487.38   96698.61  92909.83
#> 2024-12-27 01:00:00 100670.65   96512.96  92355.27
#> 2024-12-28 01:00:00 100632.13   96581.91  92531.69
#> 2024-12-29 01:00:00  99628.77   95576.60  91524.43
#> 2024-12-30 01:00:00  96403.53   94231.31  92059.09
#> 2024-12-31 01:00:00 95441.13 93774.23 92107.34{talib} recognizes 61 candlestick patterns—from single-candle
formations like Doji and Hammer to multi-candle patterns like Morning
Star and Three White Soldiers. Each pattern returns a normalized score:
1 (bullish), -1 (bearish), or 0
(no pattern).
## detect Engulfing patterns:
## 1 = bullish, -1 = bearish, 0 = none
tail(
talib::engulfing(BTC)
)
#> CDLENGULFING
#> 2024-12-26 01:00:00 -1
#> 2024-12-27 01:00:00 0
#> 2024-12-28 01:00:00 0
#> 2024-12-29 01:00:00 -1
#> 2024-12-30 01:00:00 0
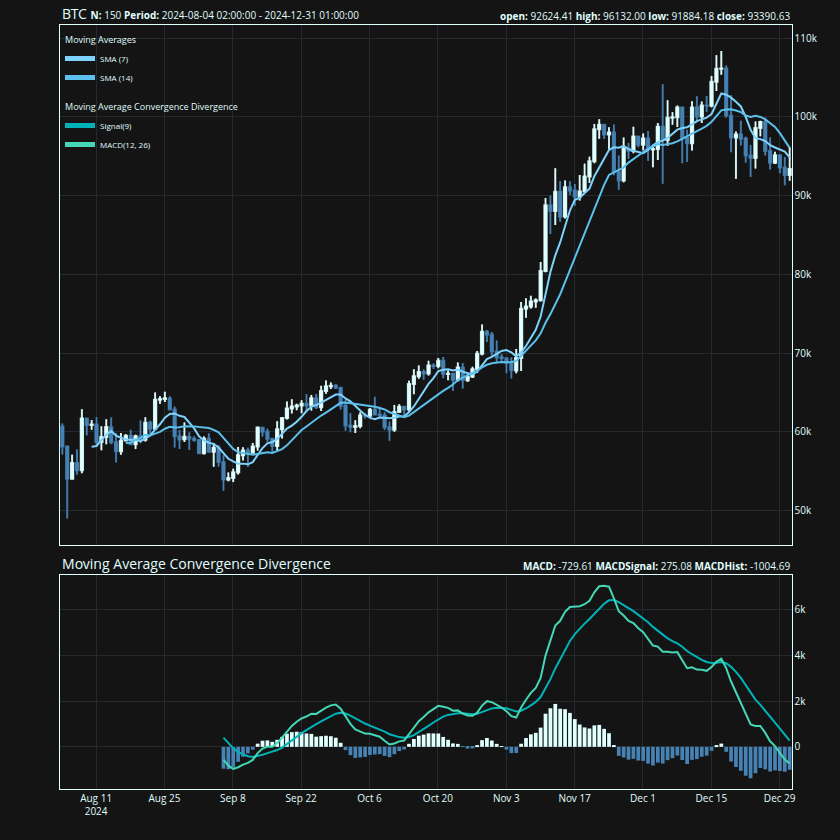
#> 2024-12-31 01:00:00 0Charts are built in two steps: chart() creates the price
chart, then indicator() layers on technical indicators.
Overlap indicators (moving averages, Bollinger Bands) draw on the price
panel; oscillators (RSI, MACD) get their own sub-panels.
{
    ## price chart with two moving
    ## averages and MACD below
    talib::chart(BTC)
    talib::indicator(talib::SMA, n = 7)
    talib::indicator(talib::SMA, n = 14)
    talib::indicator(talib::MACD)
}
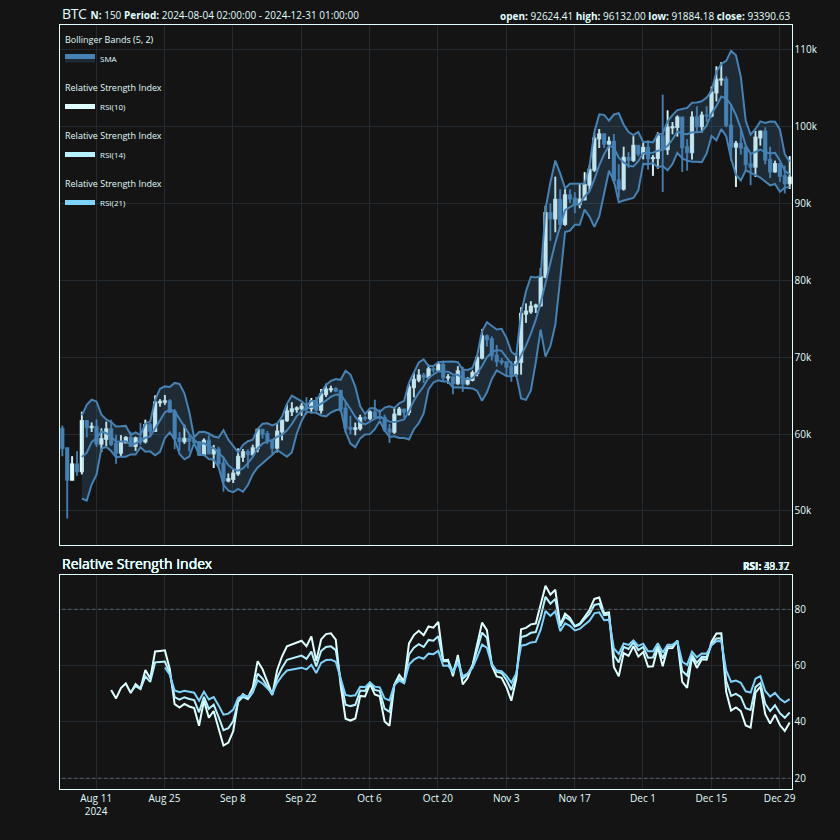
Multiple indicators can share a sub-panel by passing them as calls:
{
    talib::chart(BTC)
    talib::indicator(talib::BBANDS)

    ## pass multiple calls to combine
    ## them on a single sub-panel
    talib::indicator(
        talib::RSI(n = 10),
        talib::RSI(n = 14),
        talib::RSI(n = 21)
    )
}
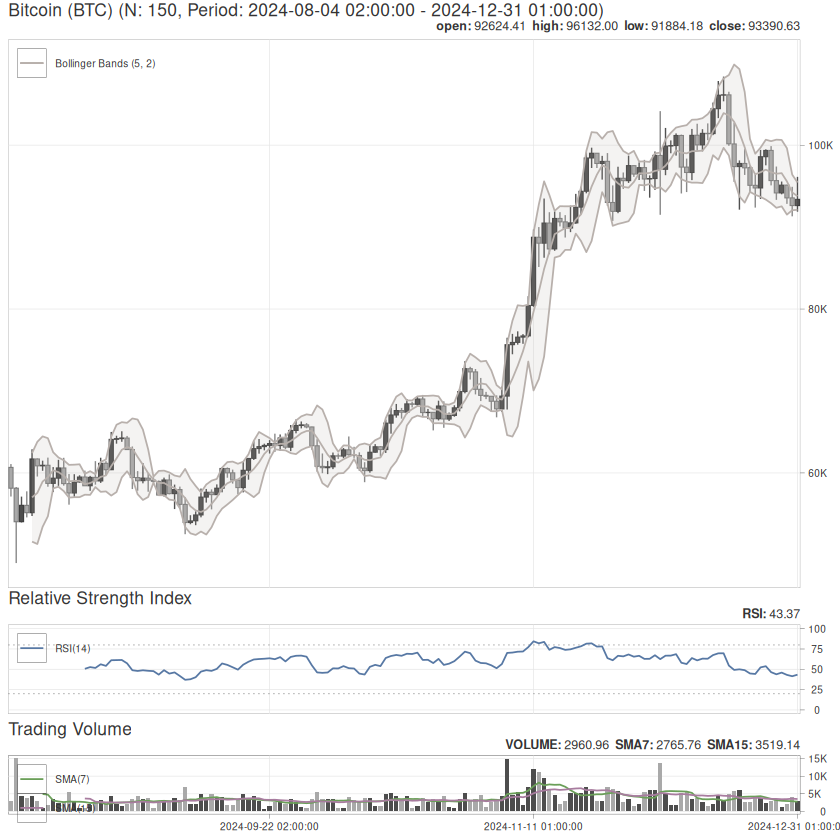
The charting system ships with 5 built-in themes:
default, hawks_and_doves, payout,
tp_slapped, and trust_the_process. Switch
themes with set_theme(). Both {plotly} (interactive,
default) and {ggplot2}
(static) backends are supported:
{
    ## switch to ggplot2 backend with
    ## the "Hawks and Doves" theme
    talib::set_theme("hawks_and_doves")
    talib::chart(BTC, title = "Bitcoin (BTC)")
    talib::indicator(talib::BBANDS)
    talib::indicator(talib::RSI)
    talib::indicator(talib::trading_volume)
}
Indicators use the columns they need automatically. When your data has non-standard column names, remap them with formula syntax:
## remap 'price' to the close column
talib::RSI(x, cols = ~price)

## remap hi, lo, last to high, low, close
talib::stochastic(x, cols = ~ hi + lo + last)Functions use descriptive snake_case names, but every function is aliased to its TA-Lib shorthand for compatibility with the broader ecosystem:
| Category | TA-Lib (C) | {talib} | {talib} alias |
|---|---|---|---|
| Overlap Studies | TA_BBANDS() |
bollinger_bands() |
BBANDS() |
| Momentum Indicators | TA_CCI() |
commodity_channel_index() |
CCI() |
| Volume Indicators | TA_OBV() |
on_balance_volume() |
OBV() |
| Volatility Indicators | TA_ATR() |
average_true_range() |
ATR() |
| Price Transform | TA_AVGPRICE() |
average_price() |
AVGPRICE() |
| Cycle Indicators | TA_HT_SINE() |
sine_wave() |
HT_SINE() |
| Pattern Recognition | TA_CDLHANGINGMAN() |
hanging_man() |
CDLHANGINGMAN() |
## snake_case and TA-Lib aliases
## are identical
all.equal(
    target = talib::bollinger_bands(BTC),
    current = talib::BBANDS(BTC)
)
#> [1] TRUEInstall the release version from CRAN:
install.packages("talib")Install the development version from GitHub:
pak::pak("serkor1/ta-lib-R")Unknown flags passed to configure are forwarded verbatim
to both the CMake build of the vendored TA-Lib and the R wrapper compile
step. Rebuild from source with any compiler flags you like:
install.packages(
    "talib",
    type = "source",
    configure.args = "-O3 -march=native"
)
Or from a local clone:
git clone --recursive https://github.com/serkor1/ta-lib-R.git
cd ta-lib-R
R CMD INSTALL . --configure-args="-O3 -march=native"Please note that {talib} is released with a Contributor Code of Conduct. By contributing to this project, you agree to abide by its terms.
These binaries (installable software) and packages are in development.
They may not be fully stable and should be used with caution. We make no claims about them.
Health stats visible at Monitor.