
The hardware and bandwidth for this mirror is donated by dogado GmbH, the Webhosting and Full Service-Cloud Provider. Check out our Wordpress Tutorial.
If you wish to report a bug, or if you are interested in having us mirror your free-software or open-source project, please feel free to contact us at mirror[@]dogado.de.



tabular turns a pre-summarised data frame into a submission-grade clinical table and emits it natively to RTF, PDF, HTML, LaTeX, Typst, and DOCX — no Java, no LibreOffice, no Word automation. One short pipeline gives you decimal alignment via real font metrics, multi-level column headers, predicate-targeted styling, and group-aware pagination, built for CDISC ADaM workflows and FDA / EMA / PMDA submissions.
It is the only R table package that pairs a live HTML preview with a paginated print deliverable: the same spec you eyeball in a notebook is the one that paginates into the RTF you ship.
Scope.
tabularrenders the full set of clinical outputs – tables, listings, and figures (the “T”, “L”, and “F” of TFL) – to RTF, LaTeX, Typst, HTML, PDF, and DOCX from one verb pipeline. A zero-row table renders an empty-data placeholder (“No data available to report”) in the body, with the page chrome and column headers intact.
Install the released version from CRAN:
install.packages("tabular")Or the development version from GitHub:
# install.packages("pak")
pak::pak("vthanik/tabular")
# or
remotes::install_github("vthanik/tabular")
R dependencies install automatically. The backends differ in what else they need:
| Backend | Extra requirement |
|---|---|
| RTF, DOCX, HTML, Markdown | none — pure R, no Java, no
pandoc, no Office |
LaTeX (.tex source), Typst (.typ
source) |
none — tabular writes the
source |
| one of two engines: a TeX install (xelatex), or a typst binary — Quarto ≥ 1.4 bundles one, so most machines already qualify |
PDF is the only backend that shells out, and it has two engines:
emit(spec, "out.pdf") compiles
via xelatex when a usable TeX is found.
tabularray + ninecolors ship with
tabular, so no tlmgr_install() step is needed
even on locked-down servers (Domino, Posit Workbench) where
tlmgr install is impossible.emit()
falls back to the typst compiler (the standalone binary, or
the copy bundled inside Quarto, which ships with RStudio / Posit
Workbench). No TeX installation at all, and compiles in well under a
second.Pass format = "latex" or format = "typst"
to pick an engine explicitly; with neither engine present, install
one:
install.packages("tinytex")
tinytex::install_tinytex(bundle = "TinyTeX") # one-time TeX setup
# or: install Quarto (https://quarto.org) — it bundles the typst engine
check_latex() reports which LaTeX packages resolve
(probed through kpsewhich, the same resolver
xelatex uses) and prints the remedy for anything genuinely
missing; check_typst() does the same for the typst engine
(binary, version floor, and the font chain PDFs render in);
check_fonts(spec) audits the fonts a spec asks for, per
backend.
tabular::check_latex()   # LaTeX-PDF readiness, with the install remedy
tabular::check_typst()   # Typst-PDF readiness (no TeX needed)
TeX Live on a managed OS. If TeX Live came from the system package manager (RHEL
dnf, Debian/Ubuntuapt), itstlmgris usually locked andtlmgr_install()fails on permissions. Install user-space TinyTeX alongside it rather than fighting the system copy — and never reach for--ignore-warningto force it.
The pipeline starts from a pre-summarised wide data frame (one row in
= one display row — tabular does no aggregation) and chains
one verb per concern. Every verb returns an updated, immutable
tabular_spec; the engine resolves it at render time.
library(tabular)

# BigN denominators, keyed by arm
n <- stats::setNames(cdisc_saf_n$n, cdisc_saf_n$arm_short)

# columns render in data-frame order, so put them in dose order first;
# subset to Age / Sex / Race for a compact display
keep <- c("Age (years)", "Sex, n (%)", "Race, n (%)")
demo <- cdisc_saf_demo[
  cdisc_saf_demo$variable %in% keep,
  c("variable", "stat_label", "placebo", "drug_50", "drug_100", "Total")
]

tab <- tabular(
  demo,
  titles = c(
    "Table 14.1.1",
    "Demographic and Baseline Characteristics",
    "Safety Population"
  ),
  footnotes = "Percentages are based on the number of subjects per treatment group."
) |>
  cols(
    variable = "Characteristic",
    stat_label = "Statistic",
    placebo = col_spec(
      label = "Placebo (N={n['placebo']})",
      align = "decimal"
    ),
    drug_50 = col_spec(
      label = "Drug 50 (N={n['drug_50']})",
      align = "decimal"
    ),
    drug_100 = col_spec(
      label = "Drug 100 (N={n['drug_100']})",
      align = "decimal"
    ),
    Total = col_spec(label = "Total (N={n['Total']})", align = "decimal")
  ) |>
  group_rows(by = "variable")

# render to any backend by file extension (or format = "...")
path <- emit(tab, tempfile(fileext = ".rtf")) # submission deliverable
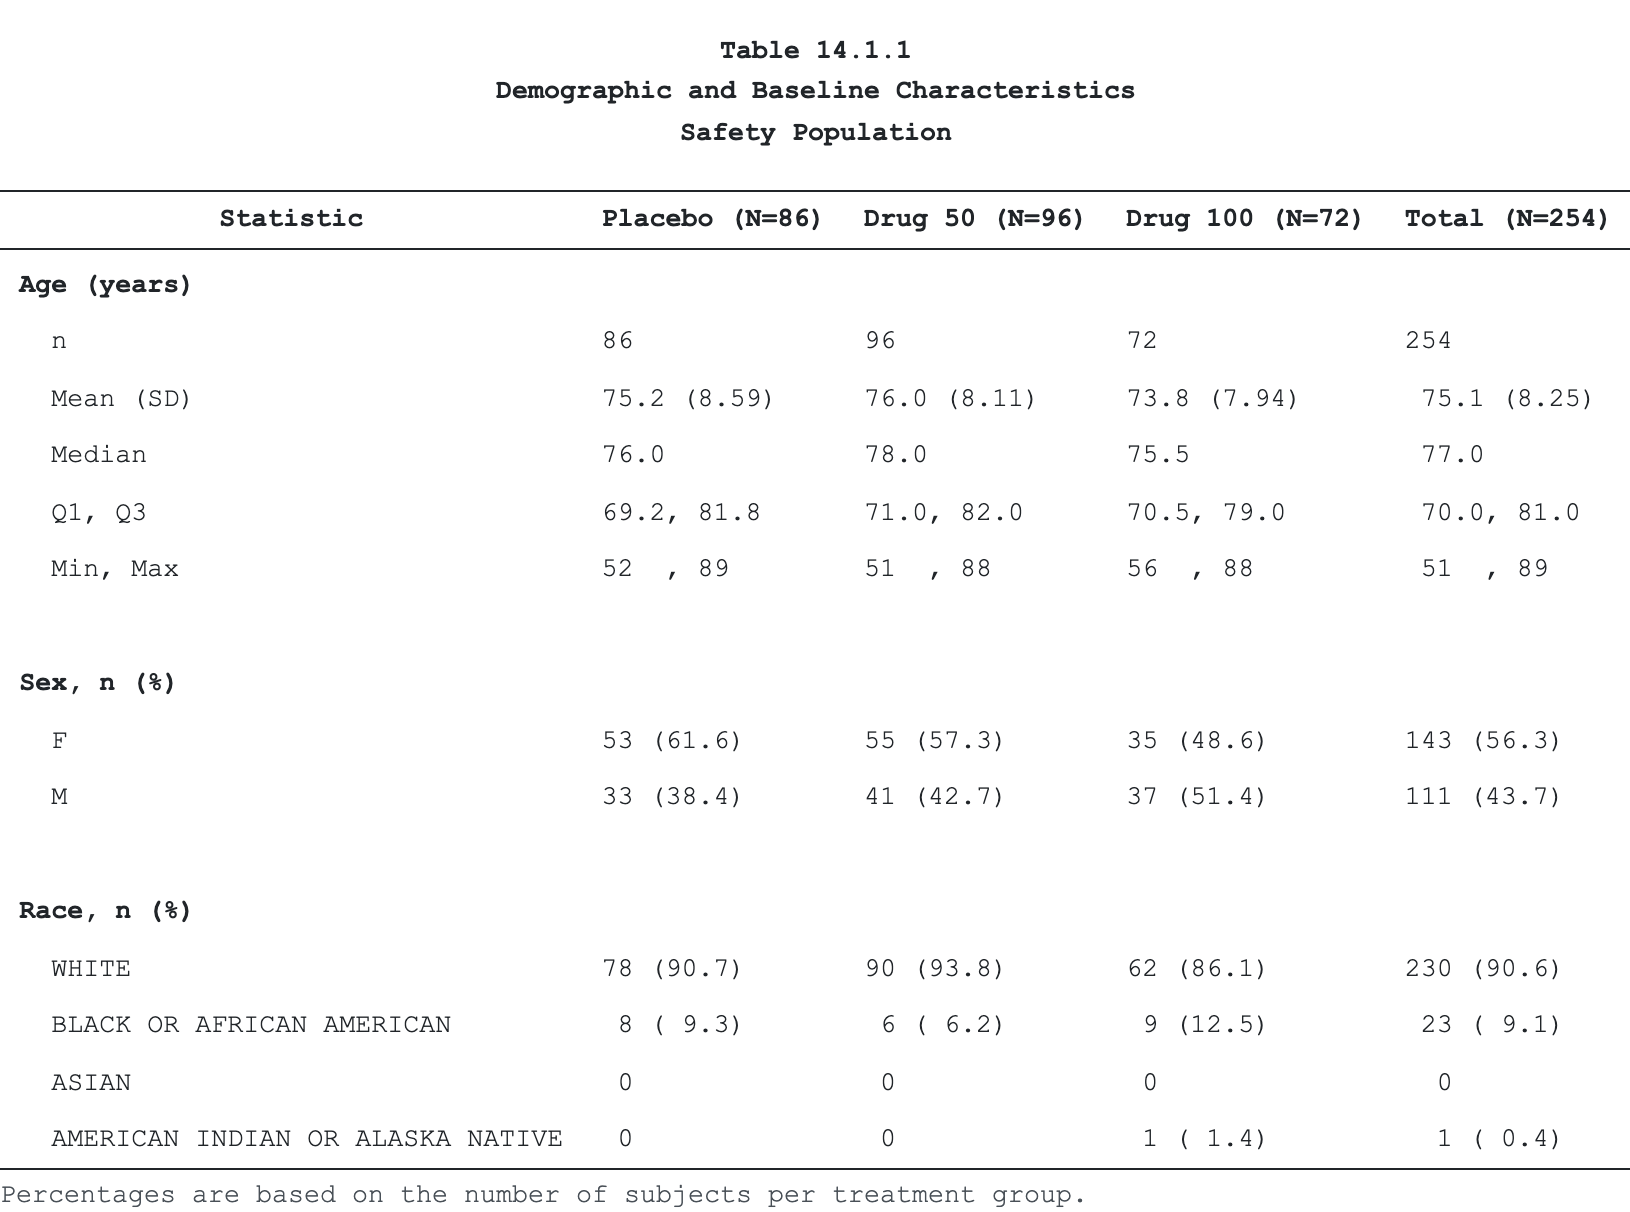
The same tab emits to every backend from the one spec.
The table below is tabular’s own HTML render — the identical spec also
produces RTF, a paginated PDF (LaTeX- or typst-compiled), a
tabularray LaTeX fragment, a native Typst document, and
native OOXML .docx:
emit()
dispatches on the file extension to RTF 1.9.1, self-contained Bootstrap
HTML, tabularray LaTeX, native Typst, native OOXML DOCX,
and PDF — compiled through LaTeX when a TeX is installed, or through the
typst engine (bundled with Quarto) on TeX-less machines. No JVM, no
Office round-trip.footnote()
anchors a marker to any cell, header, or title; the engine assigns the
glyph once, in reading order, deduped by id, and
byte-identical across every backend and page.tabular styles
and renders; it never filters, aggregates, or weights. Pair it with
cards / gtsummary / dplyr / SAS
upstream and feed it a tidy wide frame.emit(data_file = ...)
writes the resolved wide data beside the render, and a CDISC ARS audit
manifest documents the display.tabular is a renderer for pre-summarised
clinical tables, not a statistics engine. Compute the summary upstream —
with cards, gtsummary, dplyr, or
SAS — then hand the finished wide frame to tabular(). Reach
for gtsummary or rtables when you want the
package to compute the summary; reach for tabular
to render a summary you already have to submission-grade
output.
The matrix reflects each package’s documented export surface
(verified against their namespaces; via gt means
gtsummary renders through gt):
| tabular | gt | rtables | gtsummary | flextable | huxtable | |
|---|---|---|---|---|---|---|
| Computes statistics | — | — | ✓ | ✓ | — | — |
| Live HTML preview | ✓ | ✓ | — | ✓ | ✓ | ✓ |
| Native RTF | ✓ | ✓ | — | via gt | ✓ | ✓ |
| Native DOCX | ✓ | ✓ | — | via gt | ✓ | ✓ |
| LaTeX | ✓ | ✓ | — | via gt | — | ✓ |
| ✓ | ✓ | ✓ | via gt | — | ✓ | |
| Paginated submission output | ✓ | — | ✓ | — | — | — |
| Decimal align via font metrics | ✓ | — | — | — | — | — |
| CDISC ARS audit manifest | ✓ | — | — | — | — | — |
Two notes on the marks:
knit_print method). rtables
prints a monospace ASCII table by default and ships no
knit_print method, so it is — here; it can
still emit HTML through an explicit as_html() call.pivot_across()MIT © Vignesh Thanikachalam
These binaries (installable software) and packages are in development.
They may not be fully stable and should be used with caution. We make no claims about them.
Health stats visible at Monitor.