

The hardware and bandwidth for this mirror is donated by dogado GmbH, the Webhosting and Full Service-Cloud Provider. Check out our Wordpress Tutorial.
If you wish to report a bug, or if you are interested in having us mirror your free-software or open-source project, please feel free to contact us at mirror[@]dogado.de.
survalis provides a unified framework for survival
machine learning survival analysis in R. It supports a wide range of
learners, evaluation metrics, cross-validation and interpretability
methods.
survalis is available on CRAN: https://CRAN.R-project.org/package=survalis.
# Install the released version from CRAN
install.packages("survalis")

# Or install the development version from GitHub
remotes::install_github("ielbadisy/survalis")fit_*(),
predict_*(), tune_*()mlsurv_model objectsdata.frame of survival
probabilities: t=100, t=200, …fit_*/predict_* with
cv_survlearner() or score_survmodel()library(survalis)
# See all available learners
list_survlearners()
#> learner fit predict
#> <char> <char> <char>
#> 1: coxph fit_coxph predict_coxph
#> 2: aalen fit_aalen predict_aalen
#> 3: glmnet fit_glmnet predict_glmnet
#> 4: selectcox fit_selectcox predict_selectcox
#> 5: aftgee fit_aftgee predict_aftgee
#> 6: flexsurvreg fit_flexsurvreg predict_flexsurvreg
#> 7: stpm2 fit_stpm2 predict_stpm2
#> 8: bnnsurv fit_bnnsurv predict_bnnsurv
#> 9: rpart fit_rpart predict_rpart
#> 10: bart fit_bart predict_bart
#> 11: xgboost fit_xgboost predict_xgboost
#> 12: coxboost fit_coxboost predict_coxboost
#> 13: ranger fit_ranger predict_ranger
#> 14: rsf fit_rsf predict_rsf
#> 15: cforest fit_cforest predict_cforest
#> 16: blackboost fit_blackboost predict_blackboost
#> 17: survsvm fit_survsvm predict_survsvm
#> 18: survdnn fit_survdnn predict_survdnn
#> 19: orsf fit_orsf predict_orsf
#> 20: survmetalearner fit_survmetalearner predict_survmetalearner
#> learner fit predict
#> <char> <char> <char>
#> tune has_fit has_predict has_tune available
#> <char> <lgcl> <lgcl> <lgcl> <lgcl>
#> 1: <NA> TRUE TRUE FALSE TRUE
#> 2: <NA> TRUE TRUE FALSE TRUE
#> 3: tune_glmnet TRUE TRUE TRUE TRUE
#> 4: tune_selectcox TRUE TRUE TRUE TRUE
#> 5: <NA> TRUE TRUE FALSE TRUE
#> 6: tune_flexsurvreg TRUE TRUE TRUE TRUE
#> 7: <NA> TRUE TRUE FALSE TRUE
#> 8: tune_bnnsurv TRUE TRUE TRUE TRUE
#> 9: tune_rpart TRUE TRUE TRUE TRUE
#> 10: tune_bart TRUE TRUE TRUE TRUE
#> 11: tune_xgboost TRUE TRUE TRUE TRUE
#> 12: tune_coxboost TRUE TRUE TRUE TRUE
#> 13: tune_ranger TRUE TRUE TRUE TRUE
#> 14: tune_rsf TRUE TRUE TRUE TRUE
#> 15: tune_cforest TRUE TRUE TRUE TRUE
#> 16: tune_blackboost TRUE TRUE TRUE TRUE
#> 17: tune_survsvm TRUE TRUE TRUE TRUE
#> 18: tune_survdnn TRUE TRUE TRUE TRUE
#> 19: tune_orsf TRUE TRUE TRUE TRUE
#> 20: <NA> TRUE TRUE FALSE TRUE
#> tune has_fit has_predict has_tune available
#> <char> <lgcl> <lgcl> <lgcl> <lgcl>
# See only tunable learners (those with a tune_* function)
list_survlearners(has_tune = TRUE)
#> learner fit predict tune has_fit
#> <char> <char> <char> <char> <lgcl>
#> 1: glmnet fit_glmnet predict_glmnet tune_glmnet TRUE
#> 2: selectcox fit_selectcox predict_selectcox tune_selectcox TRUE
#> 3: flexsurvreg fit_flexsurvreg predict_flexsurvreg tune_flexsurvreg TRUE
#> 4: bnnsurv fit_bnnsurv predict_bnnsurv tune_bnnsurv TRUE
#> 5: rpart fit_rpart predict_rpart tune_rpart TRUE
#> 6: bart fit_bart predict_bart tune_bart TRUE
#> 7: xgboost fit_xgboost predict_xgboost tune_xgboost TRUE
#> 8: coxboost fit_coxboost predict_coxboost tune_coxboost TRUE
#> 9: ranger fit_ranger predict_ranger tune_ranger TRUE
#> 10: rsf fit_rsf predict_rsf tune_rsf TRUE
#> 11: cforest fit_cforest predict_cforest tune_cforest TRUE
#> 12: blackboost fit_blackboost predict_blackboost tune_blackboost TRUE
#> 13: survsvm fit_survsvm predict_survsvm tune_survsvm TRUE
#> 14: survdnn fit_survdnn predict_survdnn tune_survdnn TRUE
#> 15: orsf fit_orsf predict_orsf tune_orsf TRUE
#> has_predict has_tune available
#> <lgcl> <lgcl> <lgcl>
#> 1: TRUE TRUE TRUE
#> 2: TRUE TRUE TRUE
#> 3: TRUE TRUE TRUE
#> 4: TRUE TRUE TRUE
#> 5: TRUE TRUE TRUE
#> 6: TRUE TRUE TRUE
#> 7: TRUE TRUE TRUE
#> 8: TRUE TRUE TRUE
#> 9: TRUE TRUE TRUE
#> 10: TRUE TRUE TRUE
#> 11: TRUE TRUE TRUE
#> 12: TRUE TRUE TRUE
#> 13: TRUE TRUE TRUE
#> 14: TRUE TRUE TRUE
#> 15: TRUE TRUE TRUE
# Shortcut for tunable learners
list_tunable_survlearners()
#> learner fit predict tune has_fit
#> <char> <char> <char> <char> <lgcl>
#> 1: glmnet fit_glmnet predict_glmnet tune_glmnet TRUE
#> 2: selectcox fit_selectcox predict_selectcox tune_selectcox TRUE
#> 3: flexsurvreg fit_flexsurvreg predict_flexsurvreg tune_flexsurvreg TRUE
#> 4: bnnsurv fit_bnnsurv predict_bnnsurv tune_bnnsurv TRUE
#> 5: rpart fit_rpart predict_rpart tune_rpart TRUE
#> 6: bart fit_bart predict_bart tune_bart TRUE
#> 7: xgboost fit_xgboost predict_xgboost tune_xgboost TRUE
#> 8: coxboost fit_coxboost predict_coxboost tune_coxboost TRUE
#> 9: ranger fit_ranger predict_ranger tune_ranger TRUE
#> 10: rsf fit_rsf predict_rsf tune_rsf TRUE
#> 11: cforest fit_cforest predict_cforest tune_cforest TRUE
#> 12: blackboost fit_blackboost predict_blackboost tune_blackboost TRUE
#> 13: survsvm fit_survsvm predict_survsvm tune_survsvm TRUE
#> 14: survdnn fit_survdnn predict_survdnn tune_survdnn TRUE
#> 15: orsf fit_orsf predict_orsf tune_orsf TRUE
#> has_predict has_tune available
#> <lgcl> <lgcl> <lgcl>
#> 1: TRUE TRUE TRUE
#> 2: TRUE TRUE TRUE
#> 3: TRUE TRUE TRUE
#> 4: TRUE TRUE TRUE
#> 5: TRUE TRUE TRUE
#> 6: TRUE TRUE TRUE
#> 7: TRUE TRUE TRUE
#> 8: TRUE TRUE TRUE
#> 9: TRUE TRUE TRUE
#> 10: TRUE TRUE TRUE
#> 11: TRUE TRUE TRUE
#> 12: TRUE TRUE TRUE
#> 13: TRUE TRUE TRUE
#> 14: TRUE TRUE TRUE
#> 15: TRUE TRUE TRUE# List available interpretability methods
list_interpretability_methods()
#> compute plot has_compute has_plot
#> <char> <char> <lgcl> <lgcl>
#> 1: compute_shap plot_shap TRUE TRUE
#> 2: compute_pdp plot_pdp TRUE TRUE
#> 3: compute_ale plot_ale TRUE TRUE
#> 4: compute_surrogate plot_surrogate TRUE TRUE
#> 5: compute_tree_surrogate plot_tree_surrogate TRUE TRUE
#> 6: compute_varimp plot_varimp TRUE TRUE
#> 7: compute_interactions plot_interactions TRUE TRUE
#> 8: compute_counterfactual plot_counterfactual TRUE TRUE
# Show which compute_* methods have a plot_* counterpart
subset(list_interpretability_methods(), !is.na(plot))
#> compute plot has_compute has_plot
#> <char> <char> <lgcl> <lgcl>
#> 1: compute_shap plot_shap TRUE TRUE
#> 2: compute_pdp plot_pdp TRUE TRUE
#> 3: compute_ale plot_ale TRUE TRUE
#> 4: compute_surrogate plot_surrogate TRUE TRUE
#> 5: compute_tree_surrogate plot_tree_surrogate TRUE TRUE
#> 6: compute_varimp plot_varimp TRUE TRUE
#> 7: compute_interactions plot_interactions TRUE TRUE
#> 8: compute_counterfactual plot_counterfactual TRUE TRUE# List available metrics used in cross-validation and scoring
list_metrics()
#> metric direction
#> <char> <char>
#> 1: cindex maximize
#> 2: auc maximize
#> 3: brier minimize
#> 4: ibs minimize
#> 5: iae minimize
#> 6: ise minimize
#> 7: ece minimize
#> summary
#> <char>
#> 1: Harrell-style concordance index for survival predictions.
#> 2: Cumulative/dynamic time-dependent AUC at a selected evaluation time.
#> 3: Brier Score at specified evaluation time(s) (IPCW-weighted when needed).
#> 4: Integrated Brier Score over an evaluation time grid (IPCW-weighted).
#> 5: Integrated absolute error against the Kaplan-Meier curve.
#> 6: Integrated squared error against the Kaplan-Meier curve.
#> 7: Expected calibration error at a single evaluation time.
#> range
#> <char>
#> 1: [0, 1] (higher is better)
#> 2: [0, 1] (higher is better)
#> 3: [0, 1] (lower is better)
#> 4: [0, 1] (lower is better)
#> 5: [0, Inf) (lower is better)
#> 6: [0, Inf) (lower is better)
#> 7: [0, 1] (lower is better)1. Fit a model
mod_cox <- fit_coxph(Surv(time, status) ~ age + karno + celltype, data = veteran)
summary(mod_cox)
#>
#> ── coxph summary ───────────────────────────────────────────────────────────────
#> Formula:
#> Surv(time, status) ~ age + karno + celltype
#> Engine: survival
#> Learner: coxph
#> Data summary:
#> - Observations: 137
#> - Predictors: "age, karno, celltypesmallcell, celltypeadeno, celltypelarge"
#> - Time range: [1, 999]
#> - Event rate: "93.4%"
2. Predict survival probabilities
pred <- predict_coxph(mod_cox, newdata = veteran[1:5, ], times = c(100, 200))
pred
#>       t=100     t=200
#> 1 0.6142681 0.3541697
#> 2 0.6944383 0.4599242
#> 3 0.5556797 0.2860796
#> 4 0.6033305 0.3408724
#> 5 0.6959633 0.4620783
3. Evaluate model performance
Direct evalution (single split):
score <- score_survmodel(mod_cox, times = c(100, 200), metrics = c("cindex", "ibs"))
score
#>    metric value
#>    <char> <num>
#> 1: cindex 0.734
#> 2:    ibs 0.160
cv_res <- cv_survlearner(
Surv(time, status) ~ age + karno + celltype,
veteran,
fit_coxph,
predict_coxph,
times = 80,
metrics = c("cindex", "ibs"),
folds = 5,
seed = 123,
verbose = FALSE
)
cv_res
#> splits id fold metric value
#> <list> <char> <int> <char> <num>
#> 1: <vfold_split[109x28x137x8]> Fold1 1 cindex 0.699
#> 2: <vfold_split[109x28x137x8]> Fold1 1 ibs 0.227
#> 3: <vfold_split[109x28x137x8]> Fold2 2 cindex 0.812
#> 4: <vfold_split[109x28x137x8]> Fold2 2 ibs 0.141
#> 5: <vfold_split[110x27x137x8]> Fold3 3 cindex 0.695
#> 6: <vfold_split[110x27x137x8]> Fold3 3 ibs 0.217
#> 7: <vfold_split[110x27x137x8]> Fold4 4 cindex 0.698
#> 8: <vfold_split[110x27x137x8]> Fold4 4 ibs 0.188
#> 9: <vfold_split[110x27x137x8]> Fold5 5 cindex 0.688
#> 10: <vfold_split[110x27x137x8]> Fold5 5 ibs 0.138cv_summary(cv_res)
#> metric mean sd n se lower upper
#> <char> <num> <num> <int> <num> <num> <num>
#> 1: cindex 0.718 0.053 5 0.023 0.672 0.764
#> 2: ibs 0.182 0.042 5 0.019 0.146 0.2194. Benchmark multiple learners
benchmark() is the single entry point for comparing
learners: tune = FALSE (default) runs each with fixed
hyperparameters; tune = TRUE tunes each learner internally
via nested cross-validation.
bench_res <- benchmark(
  Surv(time, status) ~ age + karno + celltype,
  data = veteran,
  learners = c("coxph", "rpart", "ranger"),
  times = c(80, 160),
  metrics = c("cindex", "ibs"),
  folds = 3,
  seed = 1
  )

summarise_benchmark(bench_res)
#>    learner metric  mean    sd     n    se lower upper
#>     <char> <char> <num> <num> <int> <num> <num> <num>
#> 1:   coxph cindex 0.731 0.033     3 0.019 0.694 0.768
#> 2:   coxph    ibs 0.179 0.010     3 0.006 0.168 0.190
#> 3:   rpart cindex 0.707 0.030     3 0.017 0.674 0.741
#> 4:   rpart    ibs 0.216 0.011     3 0.006 0.204 0.228
#> 5:  ranger cindex 0.686 0.048     3 0.028 0.632 0.740
#> 6:  ranger    ibs 0.198 0.006     3 0.003 0.191 0.204
plot_benchmark(bench_res)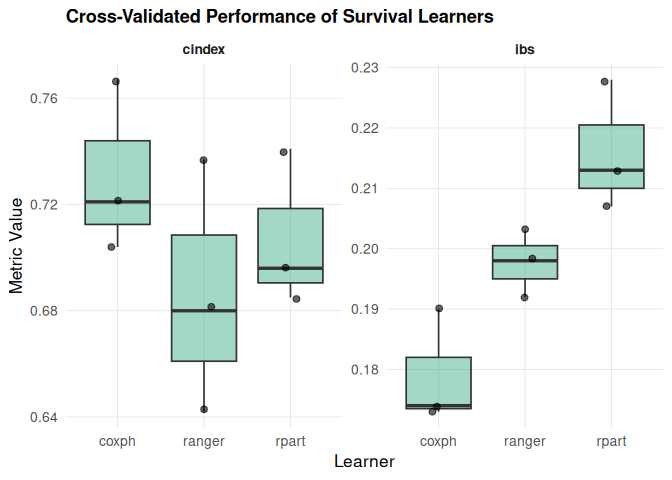
5. Kaplan-Meier curves
plot_survcurve() produces a styled Kaplan-Meier curve
with a confidence ribbon, log-rank p-value, and an aligned
number-at-risk table, in the spirit of
survminer::ggsurvplot() but implemented natively (no
dependency on survminer).
plot_survcurve(Surv(time, status) ~ trt, data = veteran)
#> Warning: Removed 2 rows containing missing values or values outside the scale range
#> (`geom_ribbon()`).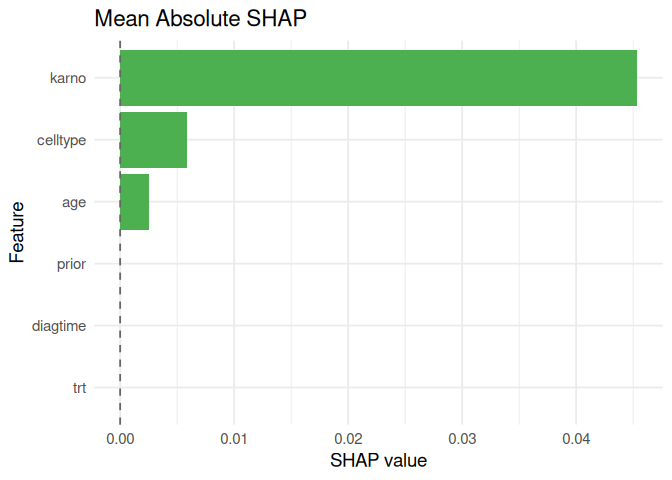
6. Visualize interpretation
shap_meanabs <- compute_shap(
  model         = mod_cox,
  newdata       = veteran[100,],
  baseline_data = veteran,
  times         = 80,
  sample.size   = 50,
  aggregate     = TRUE,
  method        = "meanabs"
  )

shap_meanabs
#>           feature         phi
#> age           age 0.003908879
#> celltype celltype 0.005120004
#> diagtime diagtime 0.000000000
#> karno       karno 0.036640340
#> prior       prior 0.000000000
#> trt trt 0.000000000plot_shap(shap_meanabs)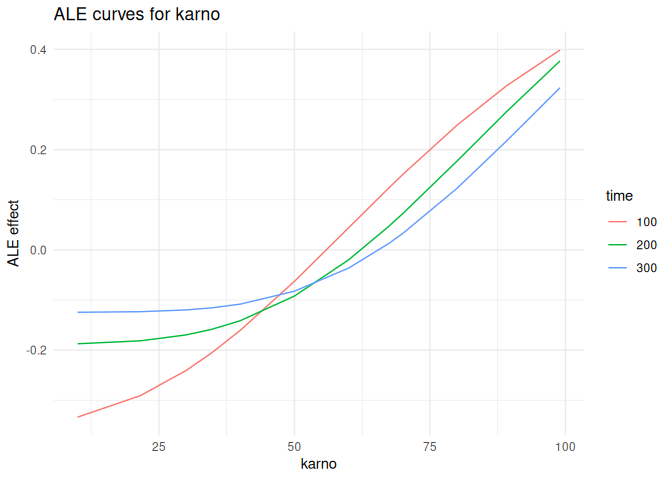
survalis also provides PDP, ALE, surrogate explanations,
tree surrogates, permutation importance, interaction analysis, and
counterfactuals.
Partial dependence and ICE
pdp_age <- compute_pdp(
  model = mod_cox,
  data = veteran,
  feature = "age",
  times = c(100, 200, 300),
  method = "pdp+ice"
  )

plot_pdp(pdp_age, feature = "age", which = "per_time")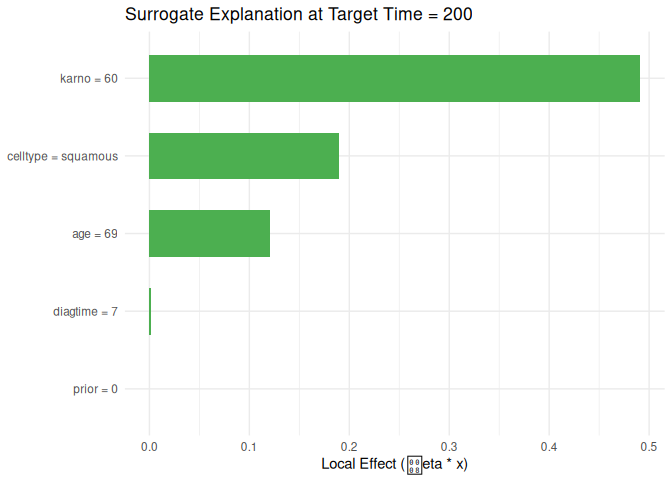
plot_pdp(pdp_age, feature = "age", which = "integrated", smooth = TRUE)
#> `geom_smooth()` using formula = 'y ~ x'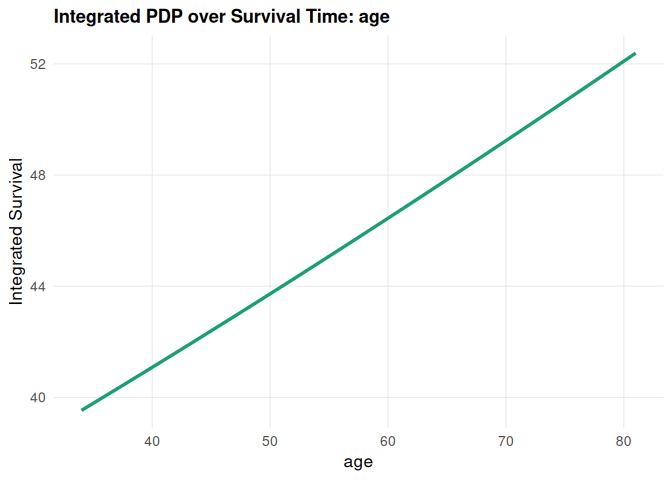
Accumulated local effects
ale_karno <- compute_ale(
  model = mod_cox,
  newdata = veteran,
  feature = "karno",
  times = c(100, 200, 300)
  )

plot_ale(ale_karno, feature = "karno", which = "per_time")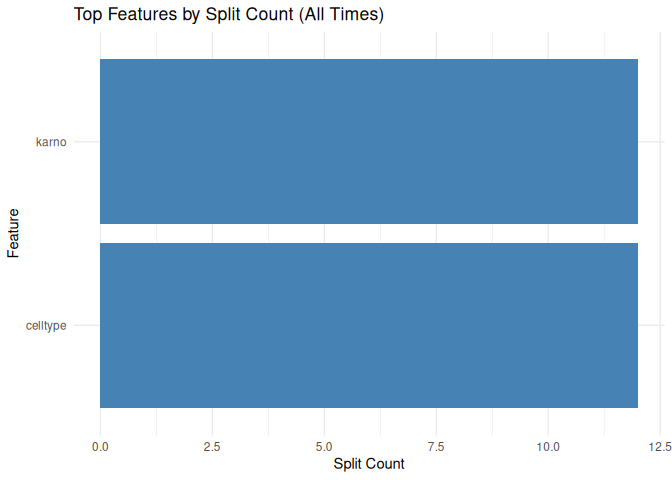
plot_ale(ale_karno, feature = "karno", which = "integrated", smooth = TRUE)
#> `geom_smooth()` using formula = 'y ~ x'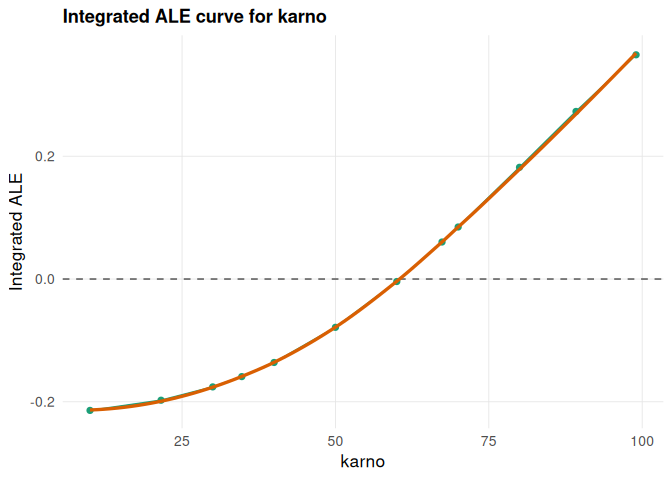
Local surrogate explanation
local_surrogate <- compute_surrogate(
  model = mod_cox,
  newdata = veteran[1, , drop = FALSE],
  baseline_data = veteran,
  times = c(100, 200, 300),
  target_time = 200,
  k = 5
  )

local_surrogate
#>    feature feature_value      effect target_time
#> 1    karno            60 0.491034890         200
#> 2 celltype      squamous 0.189632633         200
#> 3      age            69 0.120729843         200
#> 4 diagtime             7 0.001800378         200
#> 5    prior             0 0.000000000         200
plot_surrogate(local_surrogate, top_n = 10)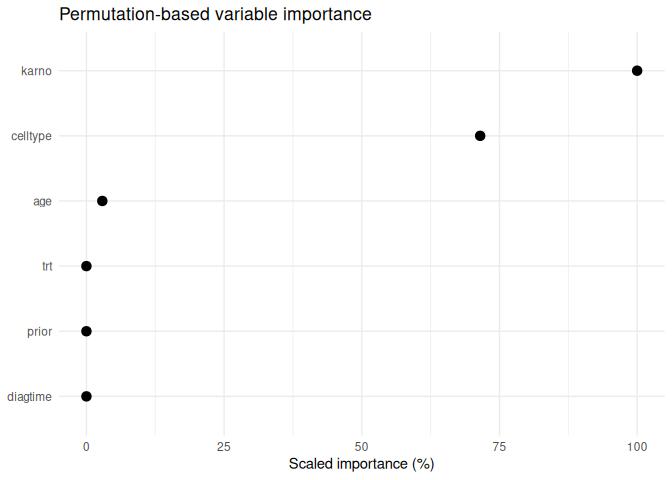
Tree surrogate
tree_surrogate <- compute_tree_surrogate(
  model = mod_cox,
  data = veteran,
  times = c(100, 200, 300)
  )

plot_tree_surrogate(tree_surrogate, type = "importance", top_n = 5)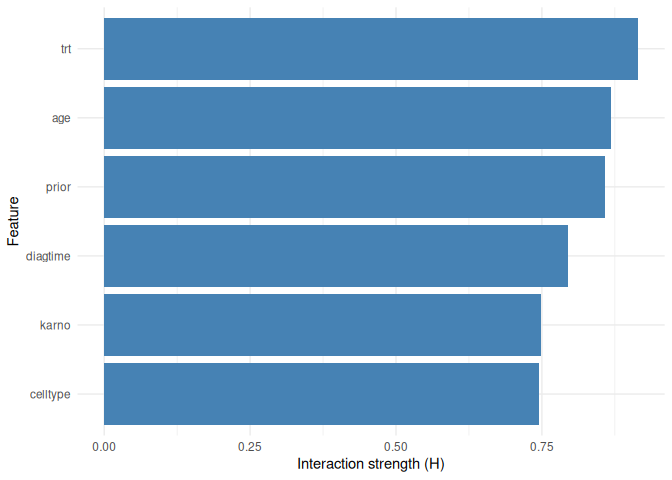
# plot_tree_surrogate(tree_surrogate, type = "tree")Permutation variable importance
varimp_res <- compute_varimp(
  model = mod_cox,
  times = c(100, 200, 300),
  metric = "ibs",
  n_repetitions = 5,
  seed = 123
  )

varimp_res
#>     feature importance importance_05 importance_95 scaled_importance
#>      <char>      <num>         <num>         <num>             <num>
#> 1:    karno     0.0672        0.0494        0.0826         100.00000
#> 2: celltype     0.0468        0.0394        0.0574          69.64286
#> 3:      age    -0.0022       -0.0030       -0.0012           3.27381
#> 4:      trt     0.0000        0.0000        0.0000           0.00000
#> 5: diagtime     0.0000        0.0000        0.0000           0.00000
#> 6:    prior     0.0000        0.0000        0.0000           0.00000
plot_varimp(varimp_res)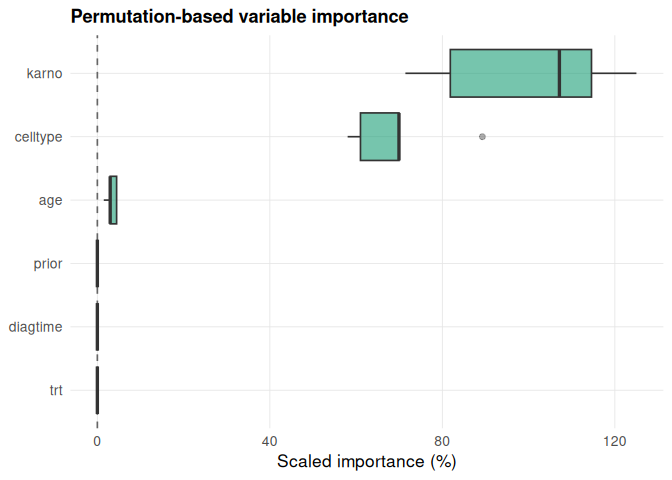
Feature interactions
interaction_1way <- compute_interactions(
  model = mod_cox,
  data = veteran,
  times = c(100, 200, 300),
  target_time = 200,
  type = "1way"
  )

interaction_heatmap <- compute_interactions(
  model = mod_cox,
  data = veteran,
  times = c(100, 200, 300),
  target_time = 200,
  type = "heatmap"
  )

interaction_time <- compute_interactions(
  model = mod_cox,
  data = veteran,
  times = c(100, 200, 300),
  type = "time"
  )

plot_interactions(interaction_1way, type = "1way")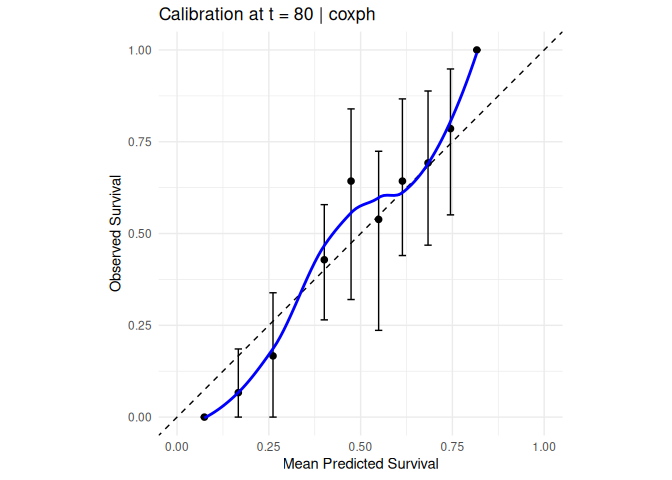
plot_interactions(interaction_heatmap, type = "heatmap")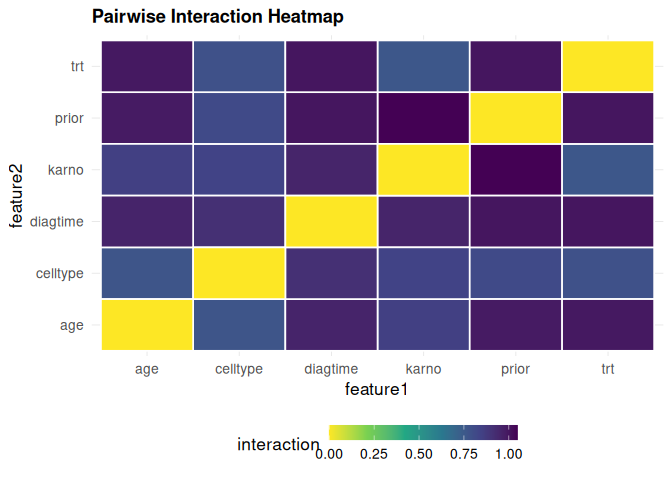
plot_interactions(interaction_time, type = "time")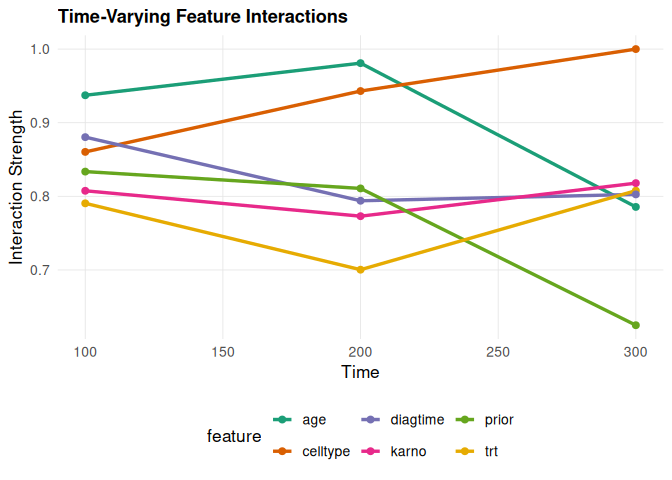
Counterfactual explanations
counterfactuals <- compute_counterfactual(
  model = mod_cox,
  newdata = veteran[1, , drop = FALSE],
  times = c(100, 200, 300),
  target_time = 200,
  features_to_change = c("age", "karno", "diagtime"),
  cost_penalty = 0.01
  )

counterfactuals
#>    feature original_value suggested_value survival_gain change_cost
#> 1    karno             60         81.0202        0.2347     21.0202
#> 2 diagtime              7          7.0808        0.0000      0.0808
#> 3      age             69         69.1313        0.0003      0.1313
#>   penalized_gain
#> 1         0.0245
#> 2        -0.0008
#> 3        -0.0010
7. Calibration
compute_calibration(
   model = mod_cox, data = veteran,
   time = "time", status = "status",
   eval_time = 80, n_bins = 10, n_boot = 30
   ) |> plot_calibration()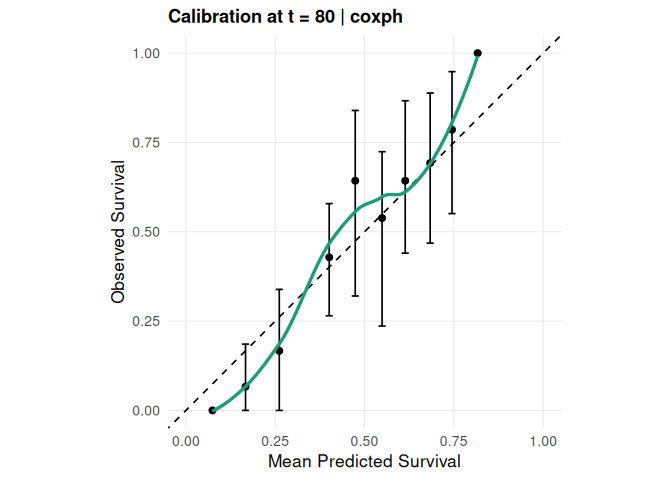
citation("survalis")These binaries (installable software) and packages are in development.
They may not be fully stable and should be used with caution. We make no claims about them.
Health stats visible at Monitor.