
The hardware and bandwidth for this mirror is donated by dogado GmbH, the Webhosting and Full Service-Cloud Provider. Check out our Wordpress Tutorial.
If you wish to report a bug, or if you are interested in having us mirror your free-software or open-source project, please feel free to contact us at mirror[@]dogado.de.
Studying Projection Pursuit INdex functions through Exploration Based on Interpolated tour paths and Line graphs. spinebil provides functionalities to evaluate the performance of projection pursuit index functions using tour methods as presented in this paper.
You can install the released version of spinebil from CRAN with:
install.packages("spinebil")You can install the development version from GitHub with:
# install.packages("devtools")
devtools::install_github("uschiLaa/spinebil")To evaluate the index behaviour on a known input distribution we can trace its value when interpolating a tour path, for example moving from nuisance and structured projection.
library(spinebil)
## sample from the spiral distribution
d <- spiral_data(100, 4)
## the first two parameters are noise
## parameters 3 and 4 contain a spiral
## we write a list with the nuisance and structured plane
m <- list(basis_matrix(1,2,4), basis_matrix(3,4,4))
## the index functions to be evaluated should also be passed in a list
index_list <- list(tourr::holes(), tourr::cmass())
index_labels <- c("holes", "cmass")
## we can now compute the index traces and plot them
trace <- get_trace(d, m, index_list, index_labels)
#> Converting input data to the required matrix format.
plot_trace(trace)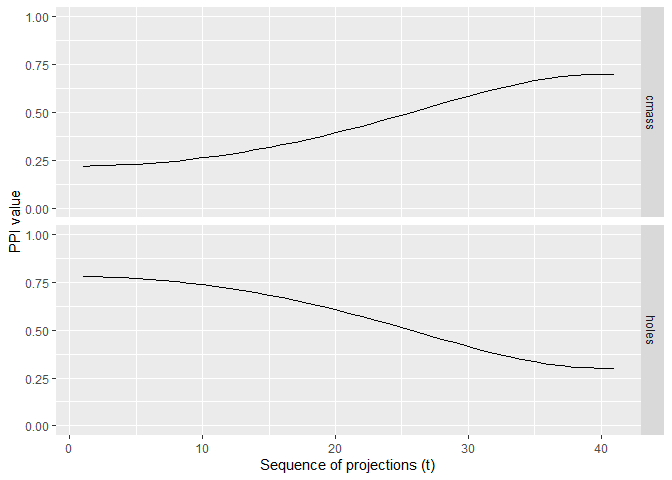
These binaries (installable software) and packages are in development.
They may not be fully stable and should be used with caution. We make no claims about them.
Health stats visible at Monitor.