The hardware and bandwidth for this mirror is donated by dogado GmbH, the Webhosting and Full Service-Cloud Provider. Check out our Wordpress Tutorial.
If you wish to report a bug, or if you are interested in having us mirror your free-software or open-source project, please feel free to contact us at mirror[@]dogado.de.
spectralGraphTopology provides estimators to learn k-component, bipartite, and k-component bipartite graphs from data by imposing spectral constraints on the eigenvalues and eigenvectors of the Laplacian and adjacency matrices. Those estimators leverage spectral properties of the graphical models as a prior information which turn out to play key roles in unsupervised machine learning tasks such as clustering.
Documentation: https://mirca.github.io/spectralGraphTopology.
From inside an R session, type:
> install.packages("spectralGraphTopology")Alternatively, you can install the development version from GitHub:
> devtools::install_github("dppalomar/spectralGraphTopology")On MS Windows environments, make sure to install the most recent
version of Rtools.
spectralGraphTopology depends on RcppArmadillo
which requires gfortran.
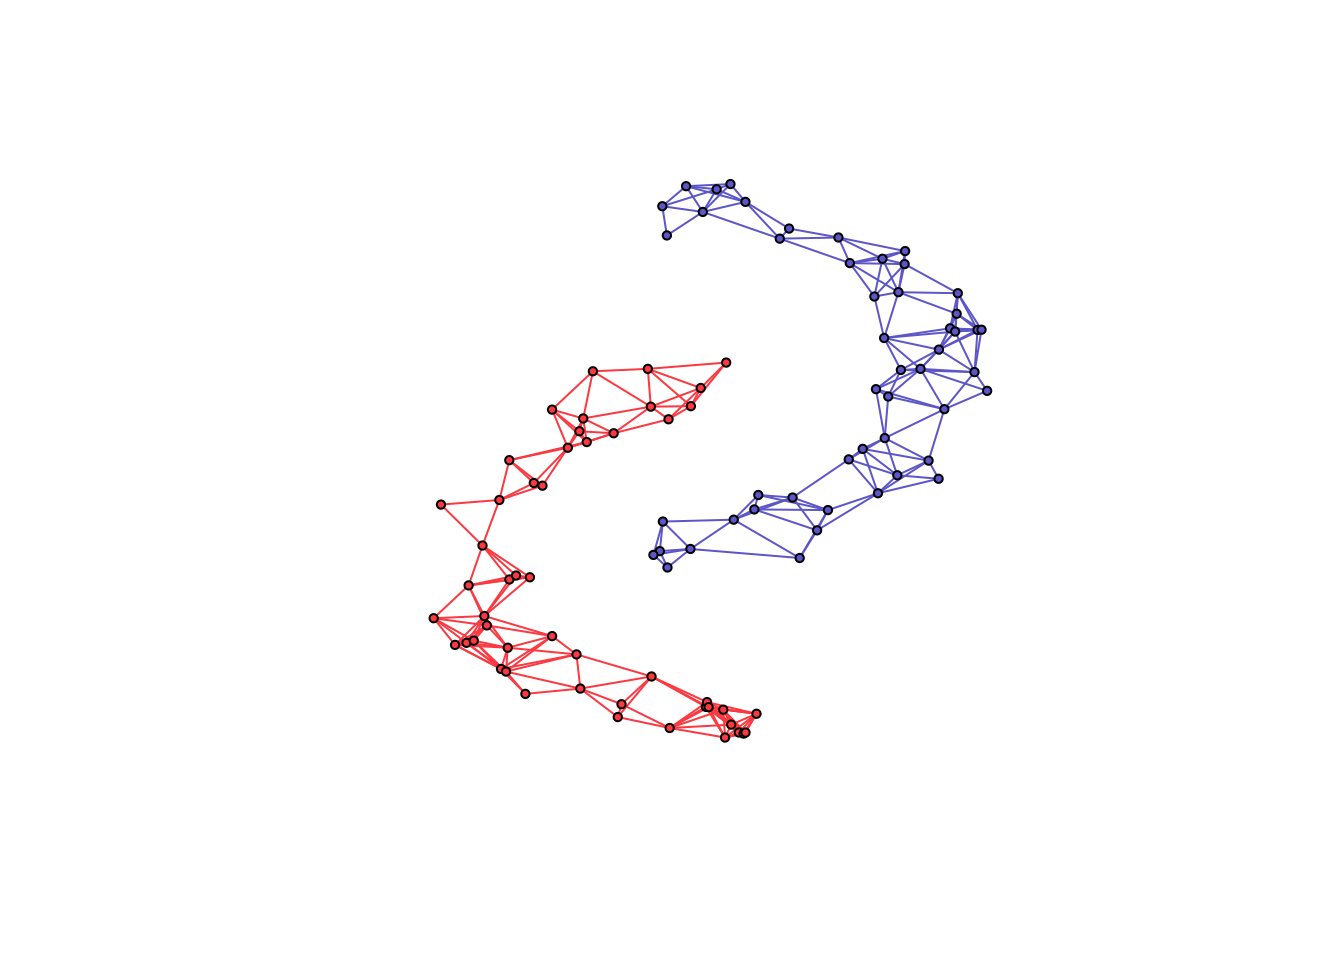
We illustrate the usage of the package with simulated data, as follows:
library(spectralGraphTopology)
library(clusterSim)
library(igraph)
set.seed(42)

# generate graph and data
n <- 50  # number of nodes per cluster
twomoon <- clusterSim::shapes.two.moon(n)  # generate data points
k <- 2  # number of components

# estimate underlying graph
S <- crossprod(t(twomoon$data))
graph <- learn_k_component_graph(S, k = k, beta = .25, verbose = FALSE, abstol = 1e-3)

# plot
# build network
net <- igraph::graph_from_adjacency_matrix(graph$adjacency, mode = "undirected", weighted = TRUE)
# colorify nodes and edges
colors <- c("#706FD3", "#FF5252")
V(net)$cluster <- twomoon$clusters
E(net)$color <- apply(as.data.frame(get.edgelist(net)), 1,
                      function(x) ifelse(V(net)$cluster[x[1]] == V(net)$cluster[x[2]],
                                        colors[V(net)$cluster[x[1]]], '#000000'))
V(net)$color <- colors[twomoon$clusters]
# plot nodes
plot(net, layout = twomoon$data, vertex.label = NA, vertex.size = 3)
We welcome all sorts of contributions. Please feel free to open an issue to report a bug or discuss a feature request.
If you made use of this software please consider citing:
J. V. de Miranda Cardoso, D. P. Palomar (2019). spectralGraphTopology: Learning Graphs from Data via Spectral Constraints. https://CRAN.R-project.org/package=spectralGraphTopology
S. Kumar, J. Ying, J. V. de Miranda Cardoso, and D. P. Palomar (2020). A unified framework for structured graph learning via spectral constraints. Journal of Machine Learning Research (21), pages 1-60.
S. Kumar, J. Ying, J. V. de Miranda Cardoso, D. P. Palomar (2019). Structured graph learning via Laplacian spectral constraints. Advances in Neural Information Processing Systems.
In addition, consider citing the following bibliography according to their implementation:
| function | reference |
|---|---|
cluster_k_component_graph |
N., Feiping, W., Xiaoqian, J., Michael I., and H., Heng. (2016). The Constrained Laplacian Rank Algorithm for Graph-based Clustering, AAAI’16. |
learn_laplacian_gle_mm |
Licheng Zhao, Yiwei Wang, Sandeep Kumar, and Daniel P. Palomar, Optimization Algorithms for Graph Laplacian Estimation via ADMM and MM, IEEE Trans. on Signal Processing, vol. 67, no. 16, pp. 4231-4244, Aug. 2019 |
learn_laplacian_gle_admm |
Licheng Zhao, Yiwei Wang, Sandeep Kumar, and Daniel P. Palomar, Optimization Algorithms for Graph Laplacian Estimation via ADMM and MM, IEEE Trans. on Signal Processing, vol. 67, no. 16, pp. 4231-4244, Aug. 2019 |
learn_combinatorial_graph_laplacian |
H. E. Egilmez, E. Pavez and A. Ortega, Graph learning from data under Laplacian and structural constraints, Journal of Selected Topics in Signal Processing, vol. 11, no. 6, pp. 825-841, Sept. 2017 |
README file: GitHub-readme
Vignette: GitHub-html-vignette, CRAN-html-vignette, NeurIPS’19 Promotional slides, NeurIPS’19 Promotional video
These binaries (installable software) and packages are in development.
They may not be fully stable and should be used with caution. We make no claims about them.
Health stats visible at Monitor.