The hardware and bandwidth for this mirror is donated by dogado GmbH, the Webhosting and Full Service-Cloud Provider. Check out our Wordpress Tutorial.
If you wish to report a bug, or if you are interested in having us mirror your free-software or open-source project, please feel free to contact us at mirror[@]dogado.de.
An R package to calculate, visualize, and decompose various segregation indices. The package currently supports
Find more information in vignette("segregation") and the
documentation.
The package also supports
Most methods return tidy data.tables for easy
post-processing and plotting. For speed, the package uses the data.table
package internally, and implements some functions in C++.
Most of the procedures implemented in this package are described in more detail in this SMR paper (Preprint) and in this working paper.
The package provides an easy way to calculate segregation measures, based on the Mutual Information Index (M) and Theil’s Entropy Index (H).
library(segregation)

# example dataset with fake data provided by the package
mutual_total(schools00, "race", "school", weight = "n")
#>      stat   est
#>    <char> <num>
#> 1:      M 0.426
#> 2:      H 0.419
Standard errors in all functions can be estimated via boostrapping. This will also apply bias-correction to the estimates:
mutual_total(schools00, "race", "school",
    weight = "n",
    se = TRUE, CI = 0.90, n_bootstrap = 500
)
#> 500 bootstrap iterations on 877739 observations
#>      stat   est       se          CI    bias
#>    <char> <num>    <num>      <list>   <num>
#> 1:      M 0.422 0.000775 0.421,0.423 0.00361
#> 2:      H 0.415 0.000712 0.414,0.416 0.00356
Decompose segregation into a between-state and a within-state term (the sum of these equals total segregation):
# between states
mutual_total(schools00, "race", "state", weight = "n")
#>      stat    est
#>    <char>  <num>
#> 1:      M 0.0992
#> 2:      H 0.0977

# within states
mutual_total(schools00, "race", "school", within = "state", weight = "n")
#>      stat   est
#>    <char> <num>
#> 1:      M 0.326
#> 2:      H 0.321
Local segregation (ls) is a decomposition by units or
groups (here racial groups). This function also support standard error
and CI estimation. The sum of the proportion-weighted local segregation
scores equals M:
local <- mutual_local(schools00,
    group = "school", unit = "race", weight = "n",
    se = TRUE, CI = 0.90, n_bootstrap = 500, wide = TRUE
)
#> 500 bootstrap iterations on 877739 observations
local[, c("race", "ls", "p", "ls_CI")]
#>      race    ls       p       ls_CI
#>    <fctr> <num>   <num>      <list>
#> 1:  asian 0.591 0.02255 0.582,0.601
#> 2:  black 0.876 0.19017 0.873,0.879
#> 3:   hisp 0.771 0.15167 0.767,0.775
#> 4:  white 0.183 0.62810 0.182,0.184
#> 5: native 1.352 0.00751   1.32,1.38
sum(local$p * local$ls)
#> [1] 0.422
Decompose the difference in M between 2000 and 2005, using iterative proportional fitting (IPF) and the Shapley decomposition (see Elbers 2021 for details):
mutual_difference(schools00, schools05,
    group = "race", unit = "school",
    weight = "n", method = "shapley"
)
#>              stat      est
#>            <char>    <num>
#> 1:             M1  0.42554
#> 2:             M2  0.41339
#> 3:           diff -0.01215
#> 4:      additions -0.00341
#> 5:       removals -0.01141
#> 6: group_marginal  0.01787
#> 7:  unit_marginal -0.01171
#> 8:     structural -0.00349
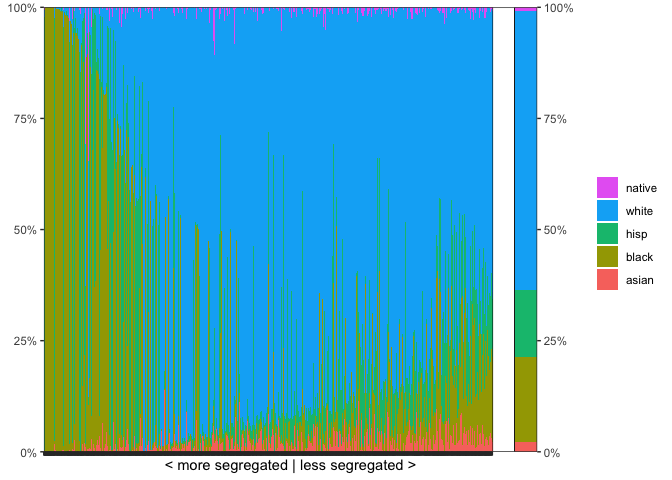
Show a segplot:
segplot(schools00, group = "race", unit = "school", weight = "n")
Find more information in the documentation.
To install the package from CRAN, use
install.packages("segregation")To install the development version, use
devtools::install_github("elbersb/segregation")If you use this package for your research, please cite one of the following papers:
Elbers, Benjamin (2021). A Method for Studying Differences in Segregation Across Time and Space. Sociological Methods & Research. https://doi.org/10.1177/0049124121986204
Elbers, Benjamin and Rob Gruijters (2023). Segplot: A New Method for Visualizing Patterns of Multi-Group Segregation. https://doi.org/10.1016/j.rssm.2023.100860
Deutsch, J., Flückiger, Y. & Silber, J. (2009). Analyzing Changes in Occupational Segregation: The Case of Switzerland (1970–2000), in: Yves Flückiger, Sean F. Reardon, Jacques Silber (eds.) Occupational and Residential Segregation (Research on Economic Inequality, Volume 17), 171–202.
DiPrete, T. A., Eller, C. C., Bol, T., & van de Werfhorst, H. G. (2017). School-to-Work Linkages in the United States, Germany, and France. American Journal of Sociology, 122(6), 1869-1938. https://doi.org/10.1086/691327
Elbers, B. (2021). A Method for Studying Differences in Segregation Across Time and Space. Sociological Methods & Research. https://doi.org/10.1177/0049124121986204
Forster, A. G., & Bol, T. (2017). Vocational education and employment over the life course using a new measure of occupational specificity. Social Science Research, 70, 176-197. https://doi.org/10.1016/j.ssresearch.2017.11.004
Theil, H. (1971). Principles of Econometrics. New York: Wiley.
Frankel, D. M., & Volij, O. (2011). Measuring school segregation. Journal of Economic Theory, 146(1), 1-38. https://doi.org/10.1016/j.jet.2010.10.008
Mora, R., & Ruiz-Castillo, J. (2003). Additively decomposable segregation indexes. The case of gender segregation by occupations and human capital levels in Spain. The Journal of Economic Inequality, 1(2), 147-179. https://doi.org/10.1023/A:1026198429377
Mora, R., & Ruiz-Castillo, J. (2009). The Invariance Properties of the Mutual Information Index of Multigroup Segregation, in: Yves Flückiger, Sean F. Reardon, Jacques Silber (eds.) Occupational and Residential Segregation (Research on Economic Inequality, Volume 17), 33-53.
Mora, R., & Ruiz-Castillo, J. (2011). Entropy-based Segregation Indices. Sociological Methodology, 41(1), 159–194. https://doi.org/10.1111/j.1467-9531.2011.01237.x
Van Puyenbroeck, T., De Bruyne, K., & Sels, L. (2012). More than ‘Mutual Information’: Educational and sectoral gender segregation and their interaction on the Flemish labor market. Labour Economics, 19(1), 1-8. https://doi.org/10.1016/j.labeco.2011.05.002
Watts, M. The Use and Abuse of Entropy Based Segregation Indices. Working Paper. URL: http://www.ecineq.org/ecineq_lux15/FILESx2015/CR2/p217.pdf
These binaries (installable software) and packages are in development.
They may not be fully stable and should be used with caution. We make no claims about them.
Health stats visible at Monitor.