The hardware and bandwidth for this mirror is donated by dogado GmbH, the Webhosting and Full Service-Cloud Provider. Check out our Wordpress Tutorial.
If you wish to report a bug, or if you are interested in having us mirror your free-software or open-source project, please feel free to contact us at mirror[@]dogado.de.
![]()
This package uses Poisson likelihood with a trend filtering penalty (a type of regularized nonparametric regression) to estimate the effective reproductive number, Rt. This value roughly says “how many new infections will result from each new infection today”. Values larger than 1 indicate that an epidemic is growing while those less than 1 indicate decline.
You can install the development version of rtestim from GitHub with:
# install.packages("remotes")
remotes::install_github("dajmcdon/rtestim")
Or the released version on CRAN
install.packages("rtestim")Here we create some data that “looks” like a typical wave in an epidemic. Because the model uses regularized regression, we estimate the model at a range of tuning parameters simultaneously.
set.seed(12345)
library(rtestim)
library(ggplot2)
dat <- data.frame(
  Time = 1:101,
  incident_cases = c(1, rpois(100, dnorm(1:100, 50, 15) * 500 + 1))
)
ggplot(dat, aes(Time, incident_cases)) +
  geom_point(colour = "cornflowerblue") +
  theme_bw()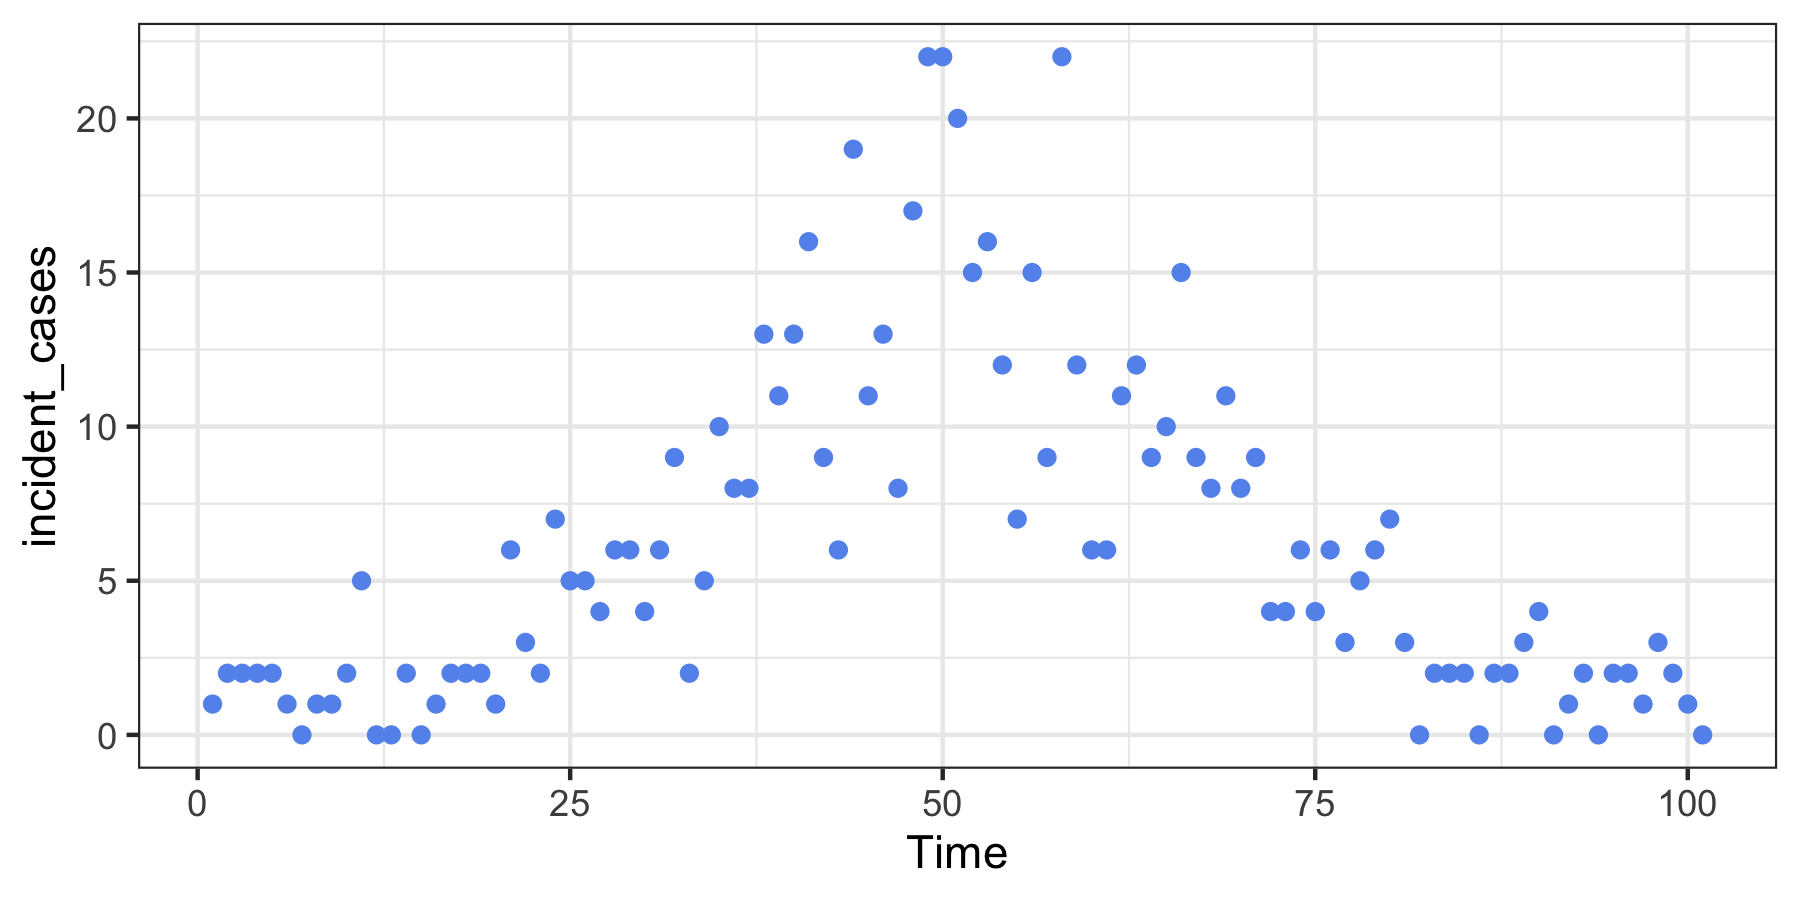
We fit the model and visualize the resulting estimated sequences of \(R_t\):
mod <- estimate_rt(observed_counts = dat$incident_cases, nsol = 20)
plot(mod)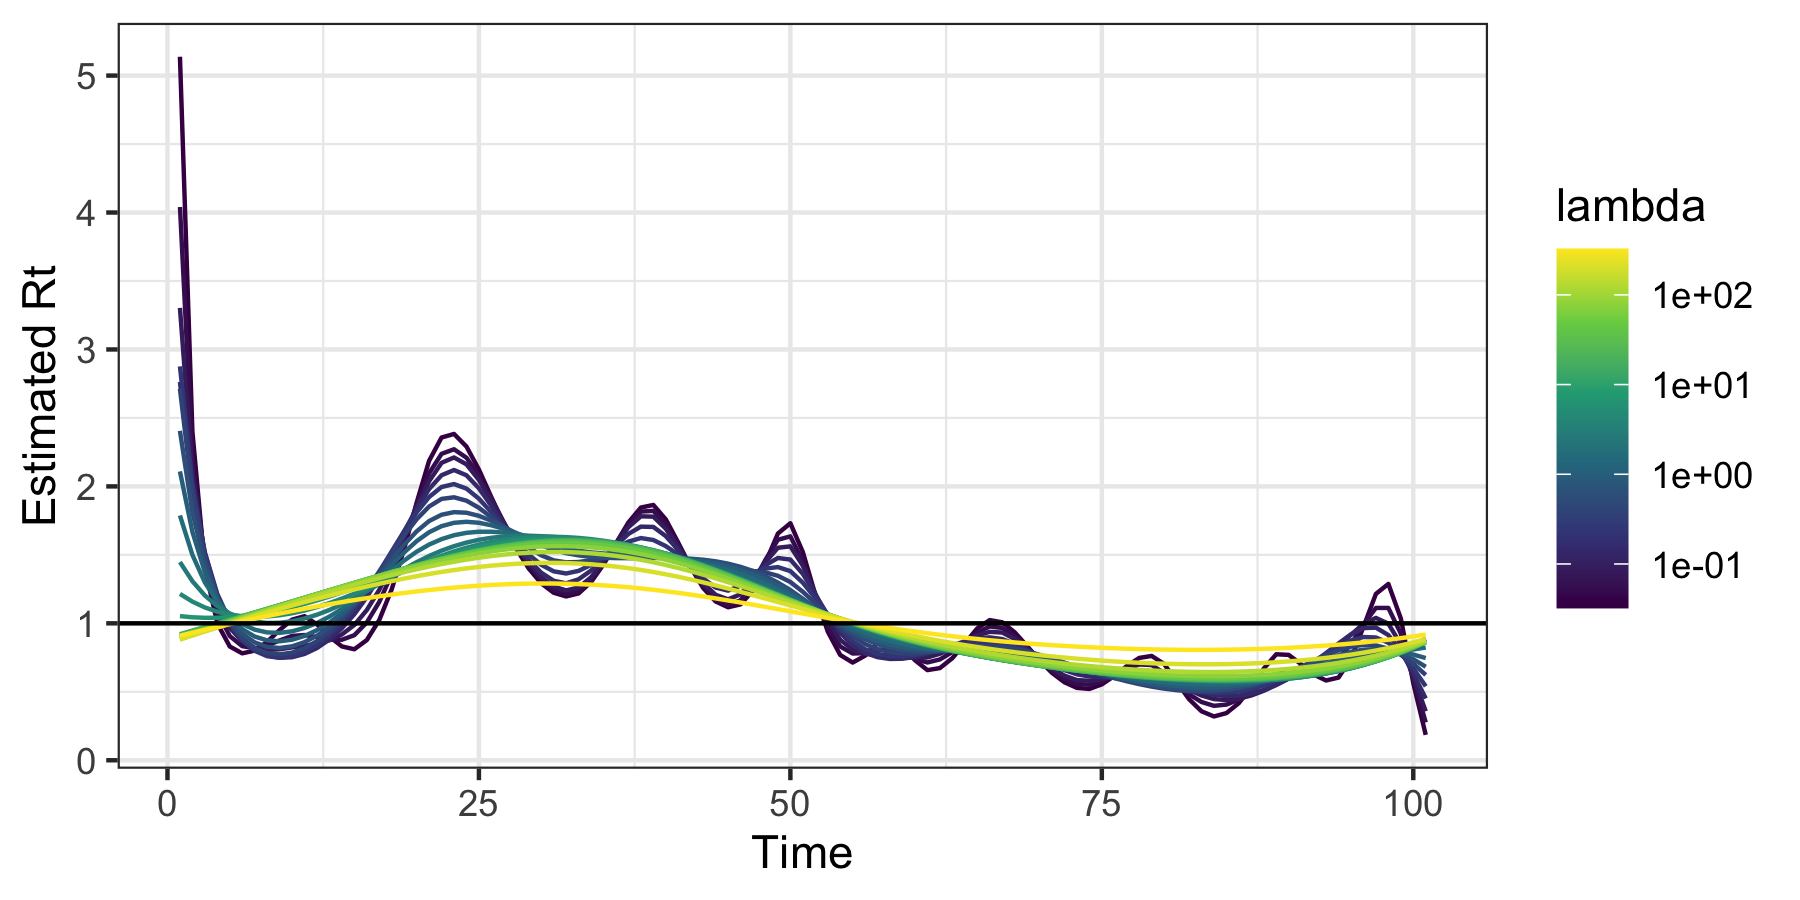
The additional parameter nsol = 20 specifies the number
of tuning parameters for which \(R_t\)
is estimated. A built in function for cross-validation can be used to
select the tuning parameter.
mod_cv <- cv_estimate_rt(dat$incident_cases, nsol = 20)
plot(mod_cv, which_lambda = "lambda.1se")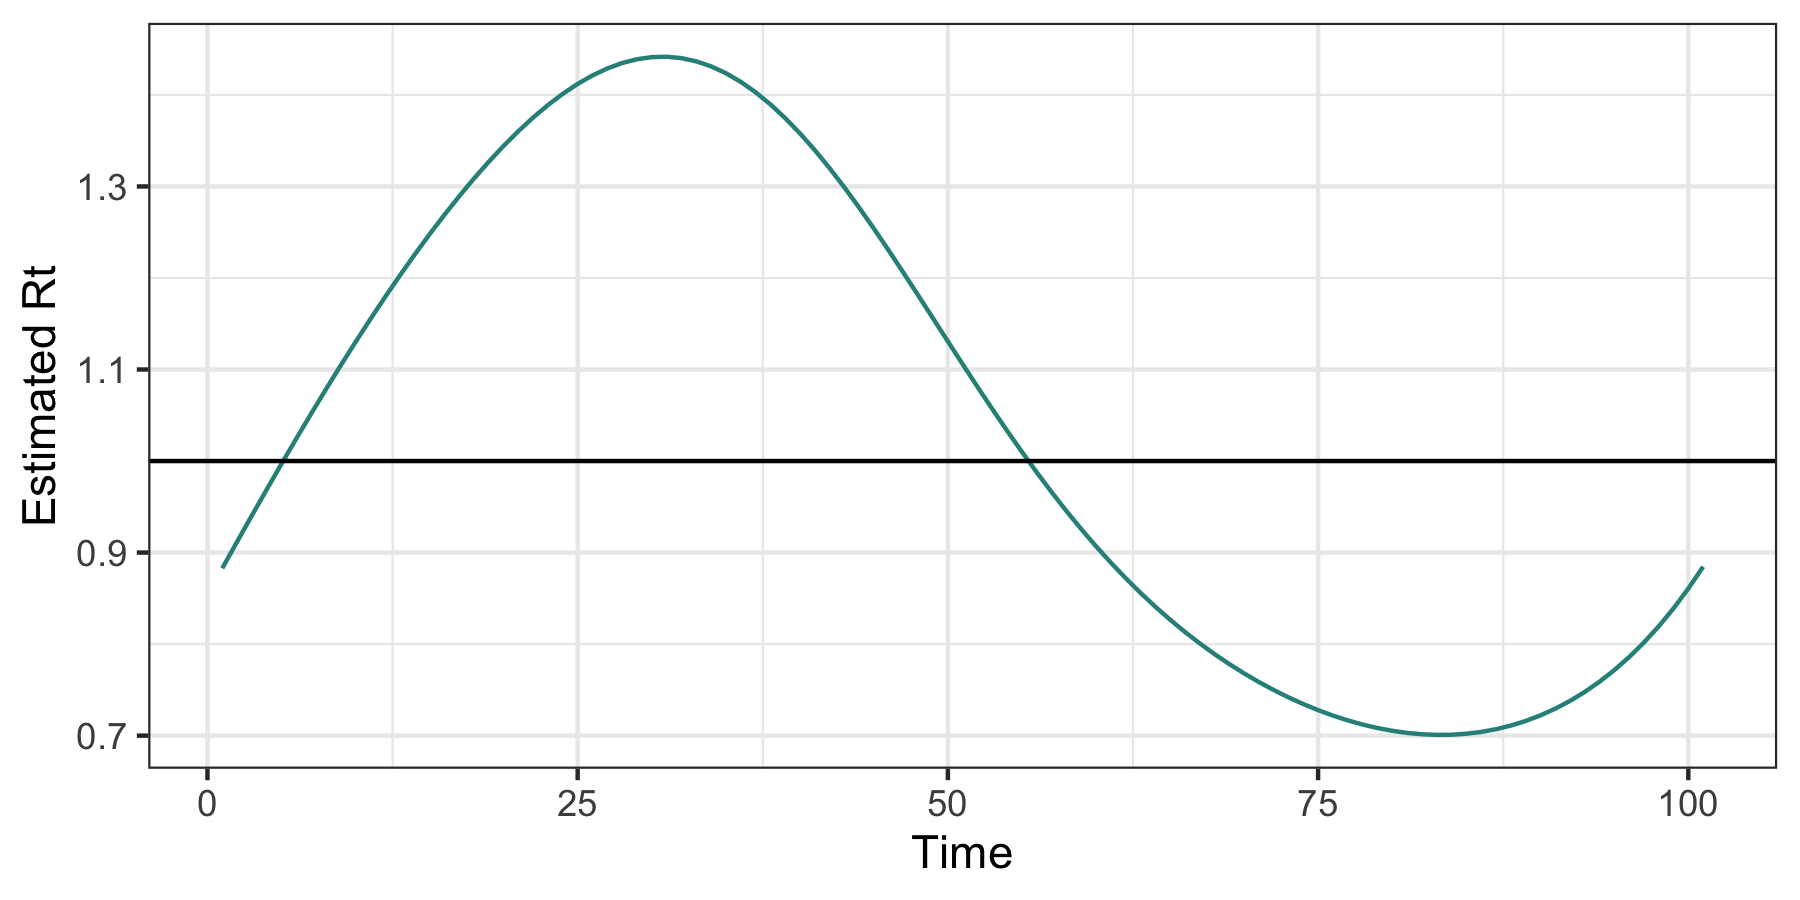
These binaries (installable software) and packages are in development.
They may not be fully stable and should be used with caution. We make no claims about them.
Health stats visible at Monitor.