The hardware and bandwidth for this mirror is donated by dogado GmbH, the Webhosting and Full Service-Cloud Provider. Check out our Wordpress Tutorial.
If you wish to report a bug, or if you are interested in having us mirror your free-software or open-source project, please feel free to contact us at mirror[@]dogado.de.
rrtableReproducible Research with a Table of R codes
2018-04-15
require(moonBook)
require(ztable)
require(rrtable)
require(ggplot2)If you are a data scientist or researcher, you will certainly be
interested in reproducible research. R package rrtable
makes it possible to make reports with HTML, LaTex, MS word or MS
Powerpoint formats from a table of R codes.
You can install R package rrtable with the following
command.
if(!require(devtools)){ install.packages("devtools") }
devtools::install_github("cardiomoon/rrtable") You can load the rrtable package with the following R
command.
require(rrtable) Sample data sampleData3 is included in rrtable package. You can see the sampleData3 by following R command.
str(sampleData3) 'data.frame': 15 obs. of 5 variables:
$ type : chr "title" "subtitle" "author" "text" ...
$ title : chr "" "" "" "Introduction" ...
$ text : chr "R package `rrtable`" "Reproducible Research with a Table of R codes" "Keon-Woong Moon" "If you are a data scientist or researcher, you will certainly be interested in reproducible research. R package"| __truncated__ ...
$ code : chr "" "" "" "" ...
$ option: chr "" "" "" "" ...You can make a paragraph with this data
df2flextable2( sampleData3 ,vanilla= FALSE )|
type |
title |
text |
code |
option |
|
title |
|
R
package |
|
|
|
subtitle |
|
Reproducible Research with a Table of R codes |
|
|
|
author |
|
Keon-Woong Moon |
|
|
|
text |
Introduction |
If
you are a data scientist or researcher, you will certainly be interested
in reproducible research. R package |
|
|
|
header2 |
Package Installation |
You
can install R package |
if(!require(devtools)){ install.packages(“devtools”) } devtools::install_github(“cardiomoon/rrtable”) |
echo=TRUE, eval=FALSE |
|
header2 |
Package Loading |
You
can load the |
require(rrtable) |
echo=TRUE |
|
header2 |
Sample Data |
Sample data sampleData3 is included in rrtable package. You can see the sampleData3 by following R command. |
str(sampleData3) |
echo=TRUE, eval=TRUE |
|
Data |
Paragraph |
You can make a paragraph with this data |
sampleData3 |
landscape=TRUE |
|
mytable |
mytable object |
You can add mytable object with the following R code. |
mytable(Dx~.,data=acs) |
|
|
plot |
Plot |
You can insert a plot into your document. |
plot(Sepal.Width~Sepal.Length,data=iris) |
|
|
ggplot |
ggplot |
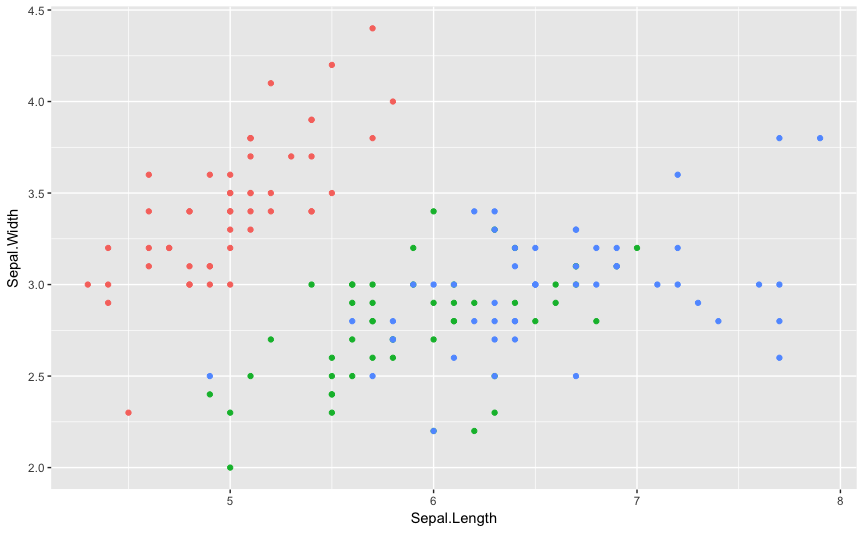
You can insert a ggplot into a document |
ggplot(iris,aes(x=Sepal.Length,y=Sepal.Width,color=Species))+ geom_point() |
|
|
Rcode |
R code |
You can insert the result of R code. For example, you can insert the result of regression analysis. |
fit=lm(mpg~wt*hp,data=mtcars) summary(fit) |
|
|
2ggplots |
Two ggplots |
You can insert two parallel ggplots with the following code. |
ggplot(iris,aes(Sepal.Length,Sepal.Width))+geom_point() ggplot(iris,aes(Sepal.Length,Sepal.Width,colour=Species))+ geom_point()+guides(colour=FALSE) |
|
|
2plots |
Two plots |
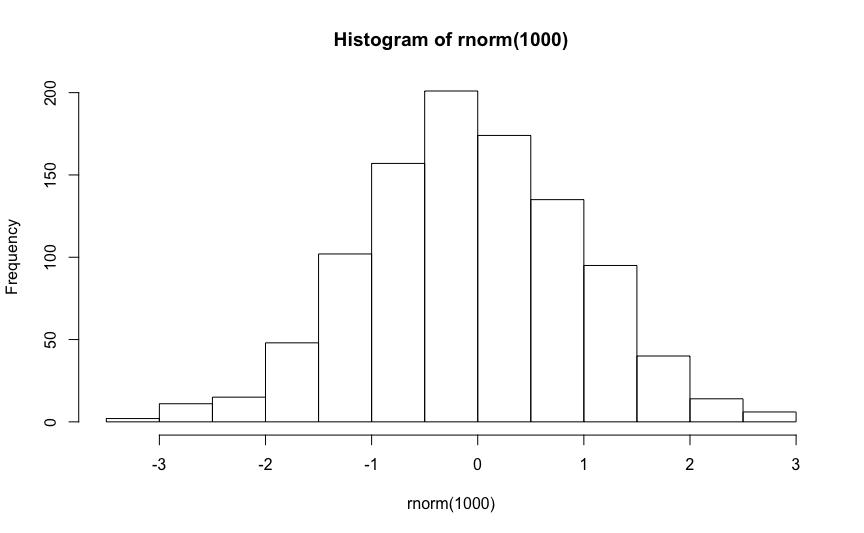
You can insert two parallel plots with the following code. |
hist(rnorm(1000)) plot(1:10) |
|
|
header2 |
HTML Report |
You can get report with HTML format(this file) by following R command. |
data2HTML(sampleData3) |
echo=TRUE, eval=FALSE |
You can add mytable object with the following R code.
mytable2flextable( mytable(Dx~.,data=acs) ,vanilla= FALSE )|
Dx |
NSTEMI |
STEMI |
Unstable.Angina |
p |
|
(N=153) |
(N=304) |
(N=400) |
||
|
age |
64.3 ± 12.3 |
62.1 ± 12.1 |
63.8 ± 11.0 |
0.073 |
|
sex |
|
0.012 |
||
|
- Female |
50 (32.7%) |
84 (27.6%) |
153 (38.2%) |
|
|
- Male |
103 (67.3%) |
220 (72.4%) |
247 (61.8%) |
|
|
cardiogenicShock |
|
< 0.001 |
||
|
- No |
149 (97.4%) |
256 (84.2%) |
400 (100.0%) |
|
|
- Yes |
4 ( 2.6%) |
48 (15.8%) |
0 ( 0.0%) |
|
|
entry |
|
0.001 |
||
|
- Femoral |
58 (37.9%) |
133 (43.8%) |
121 (30.2%) |
|
|
- Radial |
95 (62.1%) |
171 (56.2%) |
279 (69.8%) |
|
|
EF |
55.0 ± 9.3 |
52.4 ± 9.5 |
59.2 ± 8.7 |
< 0.001 |
|
height |
163.3 ± 8.2 |
165.1 ± 8.2 |
161.7 ± 9.7 |
< 0.001 |
|
weight |
64.3 ± 10.2 |
65.7 ± 11.6 |
64.5 ± 11.6 |
0.361 |
|
BMI |
24.1 ± 3.2 |
24.0 ± 3.3 |
24.6 ± 3.4 |
0.064 |
|
obesity |
|
0.186 |
||
|
- No |
106 (69.3%) |
209 (68.8%) |
252 (63.0%) |
|
|
- Yes |
47 (30.7%) |
95 (31.2%) |
148 (37.0%) |
|
|
TC |
193.7 ± 53.6 |
183.2 ± 43.4 |
183.5 ± 48.3 |
0.057 |
|
LDLC |
126.1 ± 44.7 |
116.7 ± 39.5 |
112.9 ± 40.4 |
0.004 |
|
HDLC |
38.9 ± 11.9 |
38.5 ± 11.0 |
37.8 ± 10.9 |
0.501 |
|
TG |
130.1 ± 88.5 |
106.5 ± 72.0 |
137.4 ± 101.6 |
< 0.001 |
|
DM |
|
0.209 |
||
|
- No |
96 (62.7%) |
208 (68.4%) |
249 (62.2%) |
|
|
- Yes |
57 (37.3%) |
96 (31.6%) |
151 (37.8%) |
|
|
HBP |
|
0.002 |
||
|
- No |
62 (40.5%) |
150 (49.3%) |
144 (36.0%) |
|
|
- Yes |
91 (59.5%) |
154 (50.7%) |
256 (64.0%) |
|
|
smoking |
|
< 0.001 |
||
|
- Ex-smoker |
42 (27.5%) |
66 (21.7%) |
96 (24.0%) |
|
|
- Never |
50 (32.7%) |
97 (31.9%) |
185 (46.2%) |
|
|
- Smoker |
61 (39.9%) |
141 (46.4%) |
119 (29.8%) |
|
You can insert a plot into your document.
hist(rnorm(1000))
You can insert a ggplot into a document
ggplot(iris,aes(x=Sepal.Length,y=Sepal.Width,color=Species))+ geom_point() 
You can insert the result of R code. For example, you can insert the result of regression analysis.
fit=lm(mpg~wt*hp,data=mtcars)
summary(fit)
Call:
lm(formula = mpg ~ wt * hp, data = mtcars)

Residuals:
    Min      1Q  Median      3Q     Max
-3.0632 -1.6491 -0.7362  1.4211  4.5513

Coefficients:
            Estimate Std. Error t value Pr(>|t|)
(Intercept) 49.80842    3.60516  13.816 5.01e-14 ***
wt          -8.21662    1.26971  -6.471 5.20e-07 ***
hp          -0.12010    0.02470  -4.863 4.04e-05 ***
wt:hp        0.02785    0.00742   3.753 0.000811 ***
---
Signif. codes:  0 '***' 0.001 '**' 0.01 '*' 0.05 '.' 0.1 ' ' 1

Residual standard error: 2.153 on 28 degrees of freedom
Multiple R-squared:  0.8848,    Adjusted R-squared:  0.8724
F-statistic: 71.66 on 3 and 28 DF, p-value: 2.981e-13You can insert two parallel ggplots with the following code.
ggplot(iris,aes(Sepal.Length,Sepal.Width))+geom_point()
ggplot(iris,aes(Sepal.Length,Sepal.Width,colour=Species))+ geom_point()+guides(colour=FALSE) 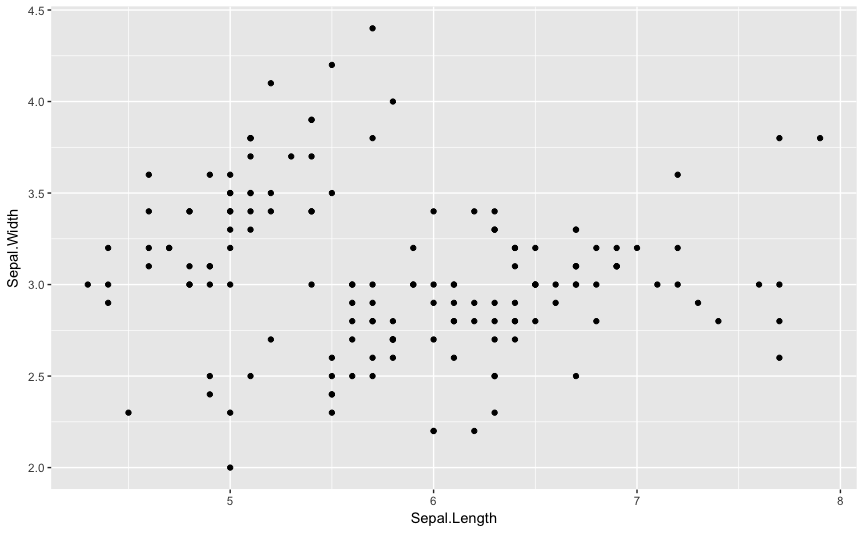
You can insert two parallel plots with the following code.
hist(rnorm(1000))
plot(1:10) 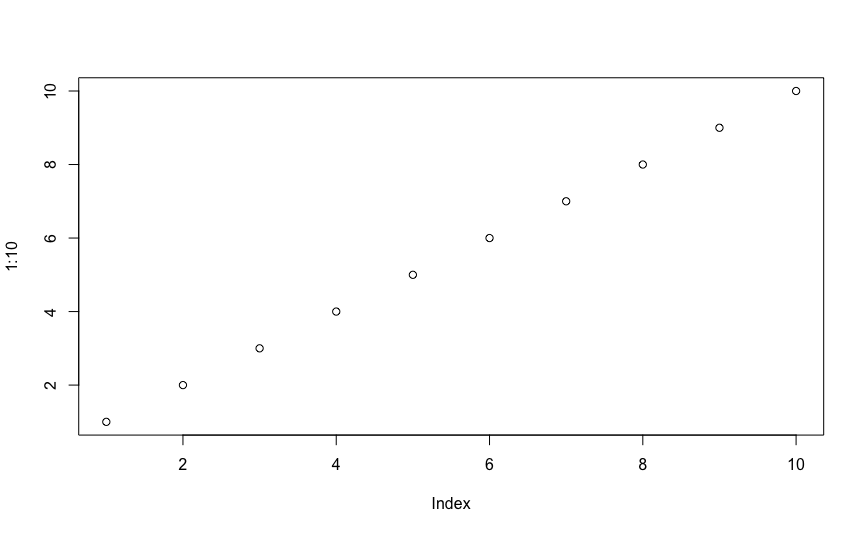
You can get report with HTML format(this file) by following R command.
data2HTML(sampleData3) You can get a report with MS word format.
data2docx(sampleData3) You can download sample data: sampleData3.docx - view with office web viewer
data2docx(sampleData2) You can download sample data: sampleData2.docx - view with office web viewer
You can get a report with MS word format.
data2pptx(sampleData3) You can download sample data: sampleData3.pptx - view with office web viewer
data2pptx(sampleData2) You can download sample data: sampleData2.pptx - view with office web viewer
You can get a report with pdf format.
data2pdf(sampleData3) You can download sample data: sampleData3.pdf
data2pdf(sampleData2) You can download sample data: sampleData2.pdf
These binaries (installable software) and packages are in development.
They may not be fully stable and should be used with caution. We make no claims about them.
Health stats visible at Monitor.