
The hardware and bandwidth for this mirror is donated by dogado GmbH, the Webhosting and Full Service-Cloud Provider. Check out our Wordpress Tutorial.
If you wish to report a bug, or if you are interested in having us mirror your free-software or open-source project, please feel free to contact us at mirror[@]dogado.de.
Wajid Jawaid 2017-07-09
Reconstructing ordered ontogenic trajectories provides methods for:
The main goal of roots is to infer plausible developmental journeys guided by the user.
library(devtools)
install_github("wjawaid/roots")Here I take the mouse adult haematopoietic data from Nestorowa et al.. Data is downloaded and processed using the goggles() function as below.
library(roots)

## Load data
blood <- read.table("http://blood.stemcells.cam.ac.uk/data/norm_counts_nestorowa_data.txt",
                    sep = " ")
cellNames <- read.table("http://blood.stemcells.cam.ac.uk/data/cell_names_nestorowa_data.txt",
                        sep = " ", stringsAsFactors = FALSE)[,1]
rownames(blood) <- gsub("LT\\.", "LT-", cellNames)
geneNames <- read.table("http://blood.stemcells.cam.ac.uk/data/gene_names_nestorowa_data.txt",
                        sep = " ", stringsAsFactors = FALSE)[,1]
colnames(blood) <- geneNames
blood <- as.matrix(blood)
rm(cellNames, geneNames)

## Load metadata
meta <- read.csv("http://blood.stemcells.cam.ac.uk/data/wj_out_jd.csv")
colnames(meta) <- c("cellType", "index", "name")
rownames(meta) <- meta$name
meta$col <- bglab::ggCol(meta$cellType)
nmeta <- data.frame(col=rep("#00000011", nrow(blood)), stringsAsFactors = FALSE,
                    row.names = rownames(blood))
nmeta[rownames(meta),"col"] <- meta$col
leg <- data.frame(cell=as.character(unique(meta$cellType)),
                  col=as.character(unique(meta$col)), stringsAsFactors = FALSE)
legOrd <- c(5, 8, 6, 7, 1, 4, 2, 3)

## Analyse
xx <- goggles(blood)

## Plot
plot(xx$l, pch=16, col = nmeta[rownames(xx$l), "col"])
legend("topright", legend = leg$cell[legOrd], fill=leg$col[legOrd], inset=0.02)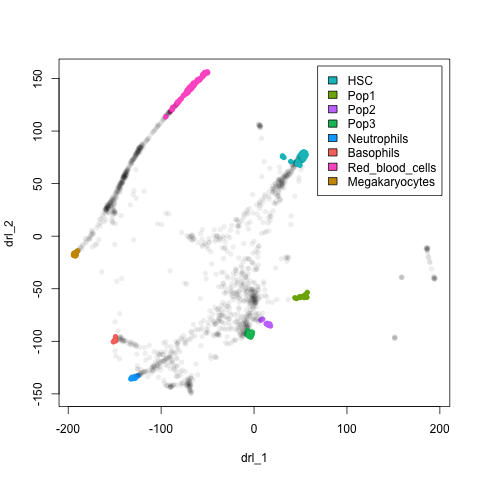
These binaries (installable software) and packages are in development.
They may not be fully stable and should be used with caution. We make no claims about them.
Health stats visible at Monitor.