
The hardware and bandwidth for this mirror is donated by dogado GmbH, the Webhosting and Full Service-Cloud Provider. Check out our Wordpress Tutorial.
If you wish to report a bug, or if you are interested in having us mirror your free-software or open-source project, please feel free to contact us at mirror[@]dogado.de.
![]()
Partitioning using local subregions (PULS) is a clustering technique designed to explore subregions of functional data for information to split the curves into clusters.
You can install the released version of puls from CRAN with:
install.packages("puls")And the development version from GitHub with:
# install.packages("remotes")
remotes::install_github("vinhtantran/puls")This is a basic example which shows you how to solve a common problem:
library(puls)
library(fda)
#> Loading required package: splines
#> Loading required package: fds
#> Loading required package: rainbow
#> Loading required package: MASS
#> Loading required package: pcaPP
#> Loading required package: RCurl
#> Loading required package: deSolve
#>
#> Attaching package: 'fda'
#> The following object is masked from 'package:graphics':
#>
#>     matplot
#> The following object is masked from 'package:datasets':
#>
#>     gait
# Build a simple fd object from already smoothed smoothed_arctic
data(smoothed_arctic)
NBASIS <- 300
NORDER <- 4
y <- t(as.matrix(smoothed_arctic[, -1]))
splinebasis <- create.bspline.basis(rangeval = c(1, 365),
                                    nbasis = NBASIS,
                                    norder = NORDER)
fdParobj <- fdPar(fdobj = splinebasis,
                  Lfdobj = 2,
                  # No need for any more smoothing
                  lambda = .000001)
yfd <- smooth.basis(argvals = 1:365, y = y, fdParobj = fdParobj)

Jan <- c(1, 31); Feb <- c(31, 59); Mar <- c(59, 90)
Apr <- c(90, 120); May <- c(120, 151); Jun <- c(151, 181)
Jul <- c(181, 212); Aug <- c(212, 243); Sep <- c(243, 273)
Oct <- c(273, 304); Nov <- c(304, 334); Dec <- c(334, 365)

intervals <-
  rbind(Jan, Feb, Mar, Apr, May, Jun, Jul, Aug, Sep, Oct, Nov, Dec)

PULS4_pam <- PULS(toclust.fd = yfd$fd, intervals = intervals,
                  nclusters = 4, method = "pam")
PULS4_pam
#> n = 39
#>
#> Node) Split, N, Cluster Inertia, Proportion Inertia Explained,
#>       * denotes terminal node
#>
#> 1) root 39 8453.2190 0.7072663
#>   2) Jul 15  885.3640 0.8431711
#>     4) Aug 8  311.7792   *
#>     5) Aug 7  178.8687   *
#>   3) Jul 24 1589.1780 0.7964770
#>     6) Jul 13  463.8466   *
#>     7) Jul 11  371.2143   *
#>
#> Note: One or more of the splits chosen had an alternative split that reduced inertia by the same amount. See "alt" column of "frame" object for details.
You can make a tree plot:
plot(PULS4_pam)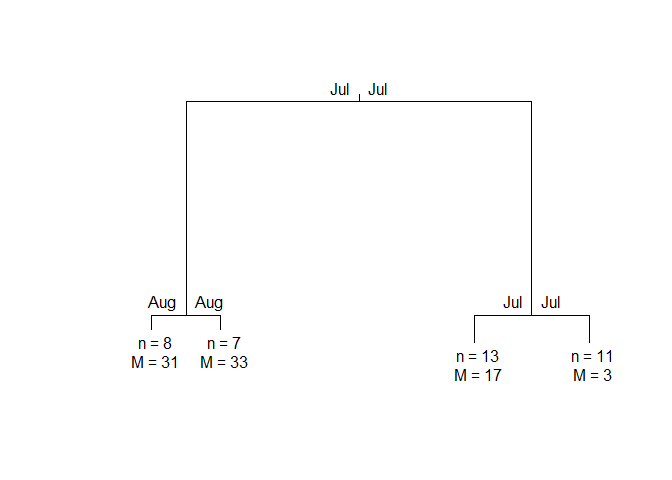
Or, a wave plot:
ggwave(toclust.fd = yfd$fd, intervals = intervals, puls = PULS4_pam)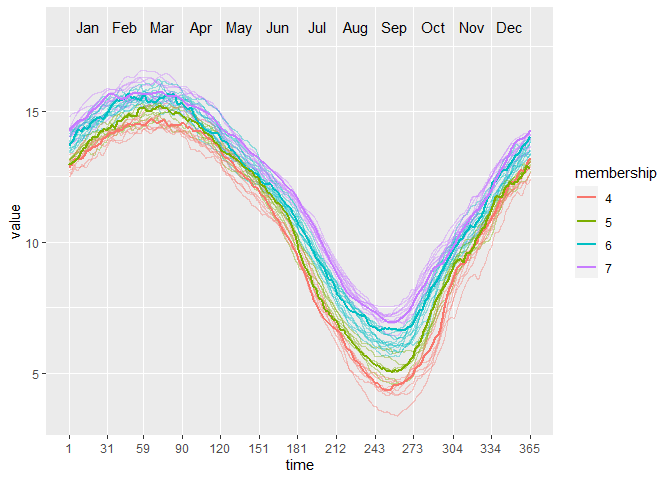
These binaries (installable software) and packages are in development.
They may not be fully stable and should be used with caution. We make no claims about them.
Health stats visible at Monitor.