
The hardware and bandwidth for this mirror is donated by dogado GmbH, the Webhosting and Full Service-Cloud Provider. Check out our Wordpress Tutorial.
If you wish to report a bug, or if you are interested in having us mirror your free-software or open-source project, please feel free to contact us at mirror[@]dogado.de.
![]()
![]()
The goal of prismadiagramR is to create a custom prismadiagram in R.
You can install the released version of prismadiagramR from CRAN with:
install.packages("prismadiagramR")And the development version from GitHub with:
# install.packages("devtools")
devtools::install_github("ltrainstg/prismadiagramR")This example shows how to create a simple automated PRISMA from a publication tracker.
set.seed(25)
N <- 100
studyStatus <- data.frame(Pub.ID = seq(1:N),
                          Source = sample(1:3, N, replace = TRUE),
                          Filter = sample(1:5, N, replace = TRUE))
studyStatus$Filter[studyStatus$Filter==5] <- NA
getPrisma(studyStatus) %>% DiagrammeR::grViz(.)
#> Warning in getPrisma(studyStatus): prismaFormat is null so attempting to
#> make automatic one from studyStatus
#> Warning in getFormatNode(prismaFormat): fontSize param not passed in
#> prismaFormat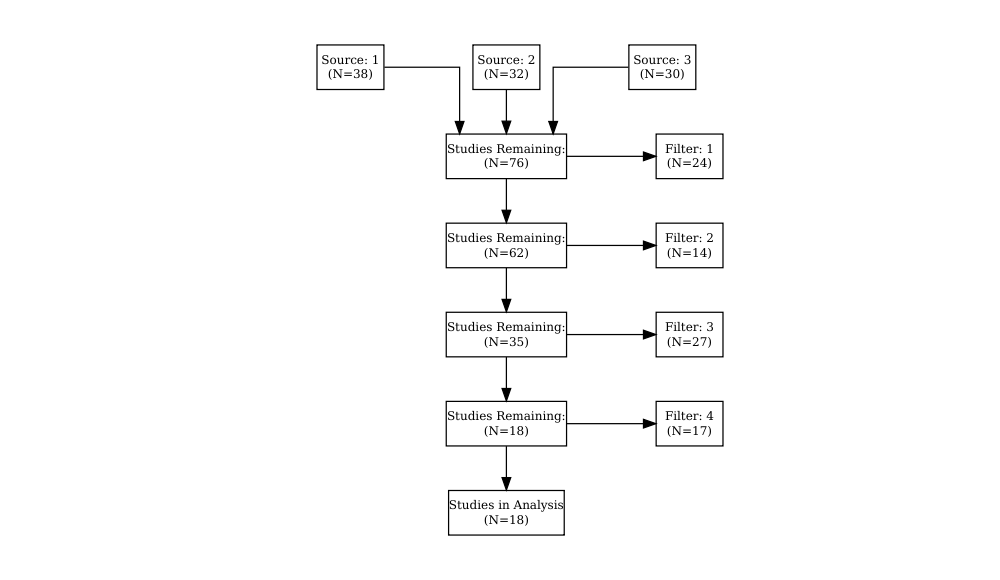
A few other R packages exist that also make PRISMA diagram that might be better for your needs.
This package was developed following these guides:
These binaries (installable software) and packages are in development.
They may not be fully stable and should be used with caution. We make no claims about them.
Health stats visible at Monitor.