The hardware and bandwidth for this mirror is donated by dogado GmbH, the Webhosting and Full Service-Cloud Provider. Check out our Wordpress Tutorial.
If you wish to report a bug, or if you are interested in having us mirror your free-software or open-source project, please feel free to contact us at mirror[@]dogado.de.
![]()


![]()
![]()

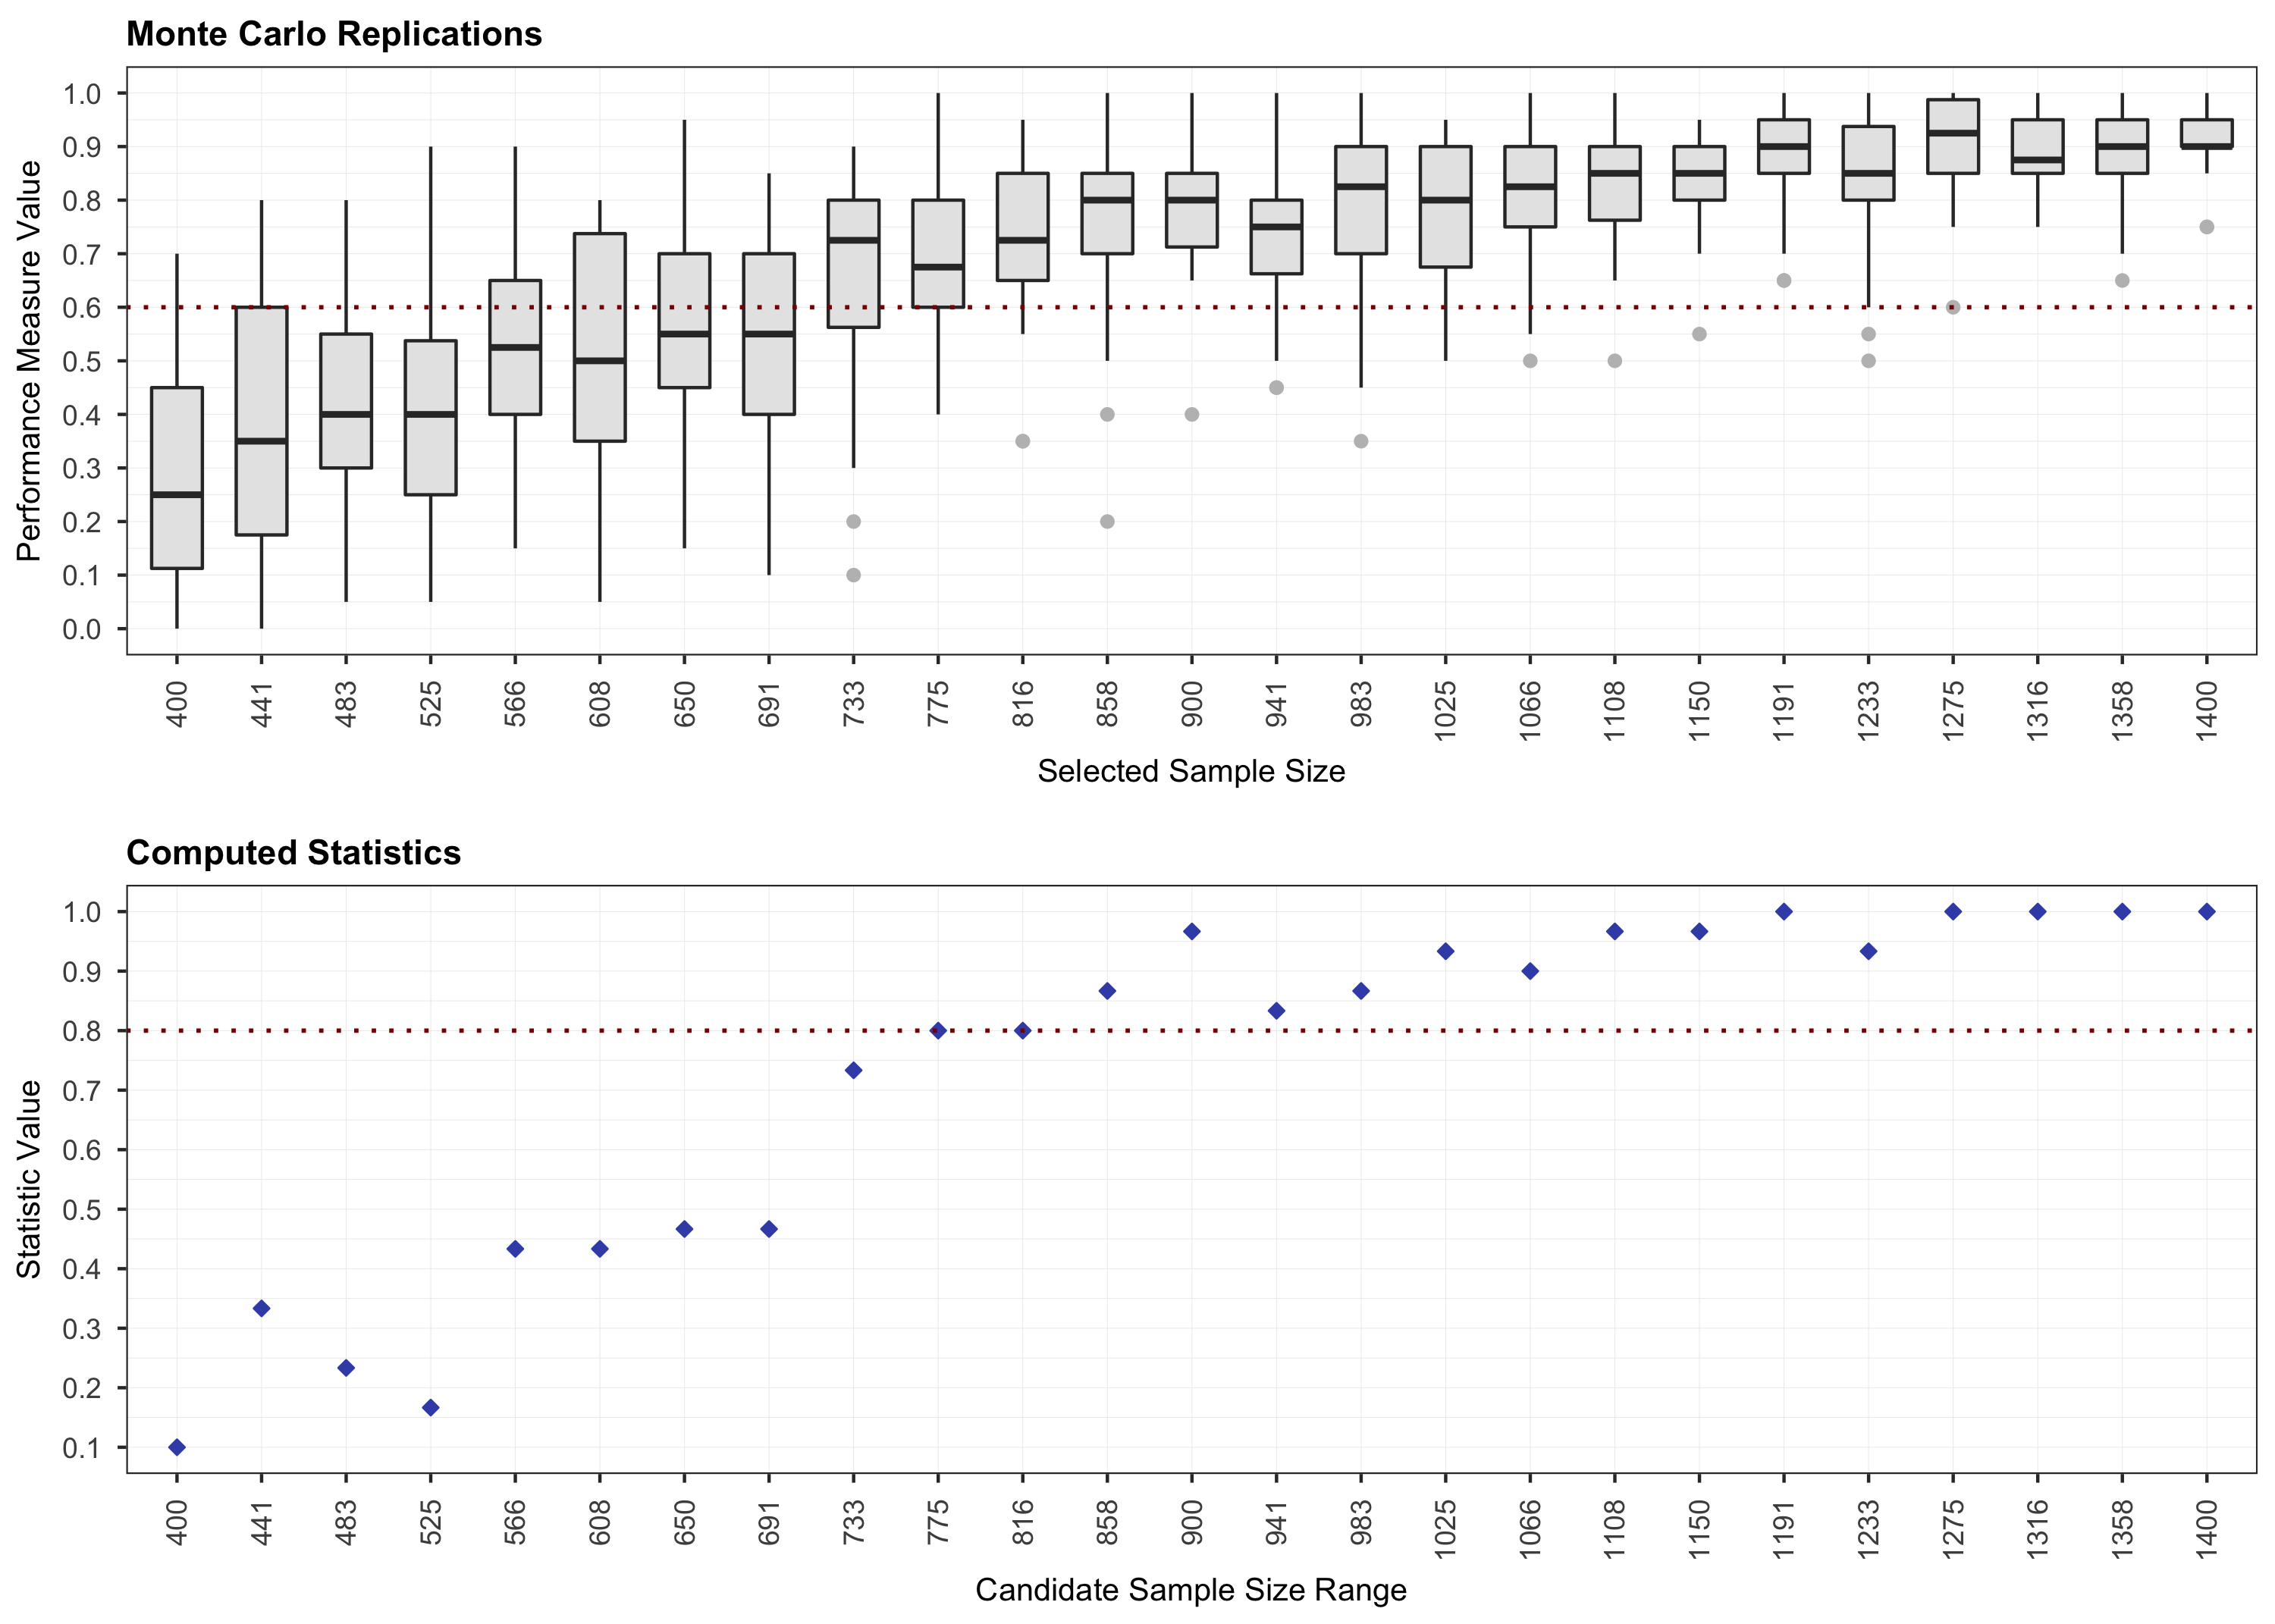
powerly is an R package that implements the
method by Constantin et al.
(2023) for conducting sample size analysis for cross-sectional
network models. The method implemented is implemented in the main
function powerly(). The implementation takes the form of a
three-step recursive algorithm designed to find an optimal sample size
value given a model specification and an outcome measure of interest. It
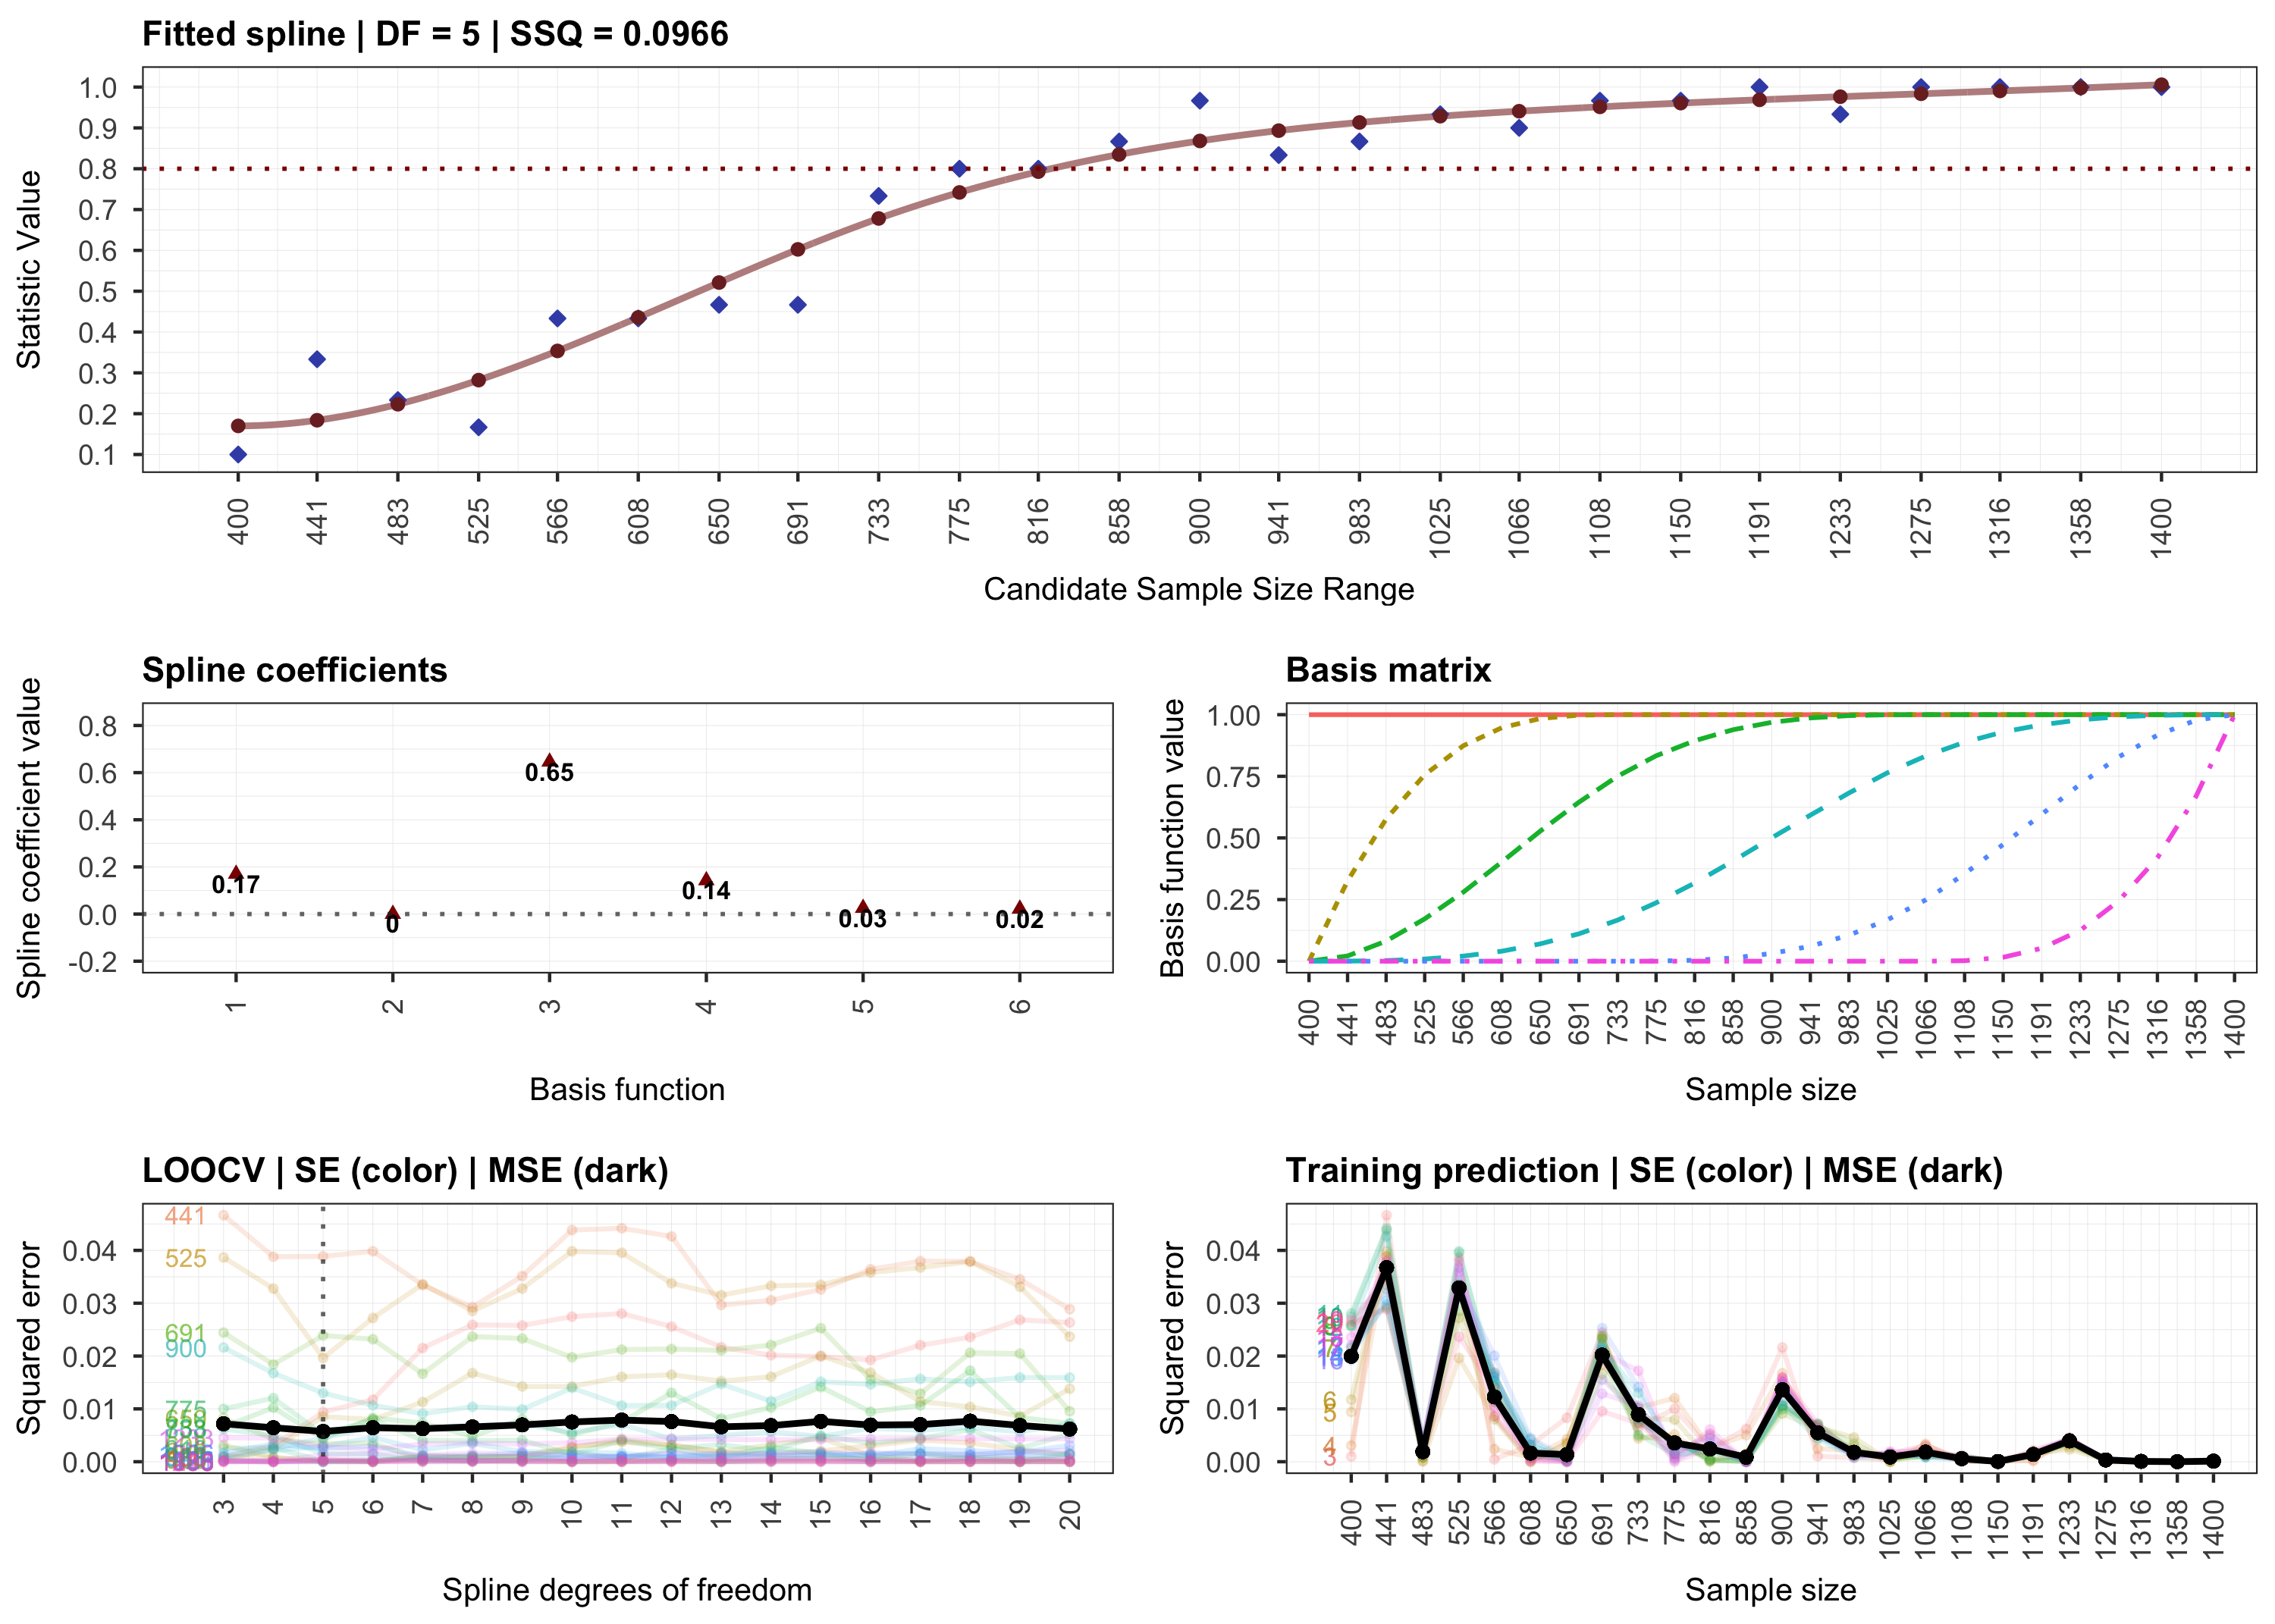
starts with a Monte Carlo simulation step for computing the outcome at
various sample sizes. Then, it continues with a monotone curve-fitting
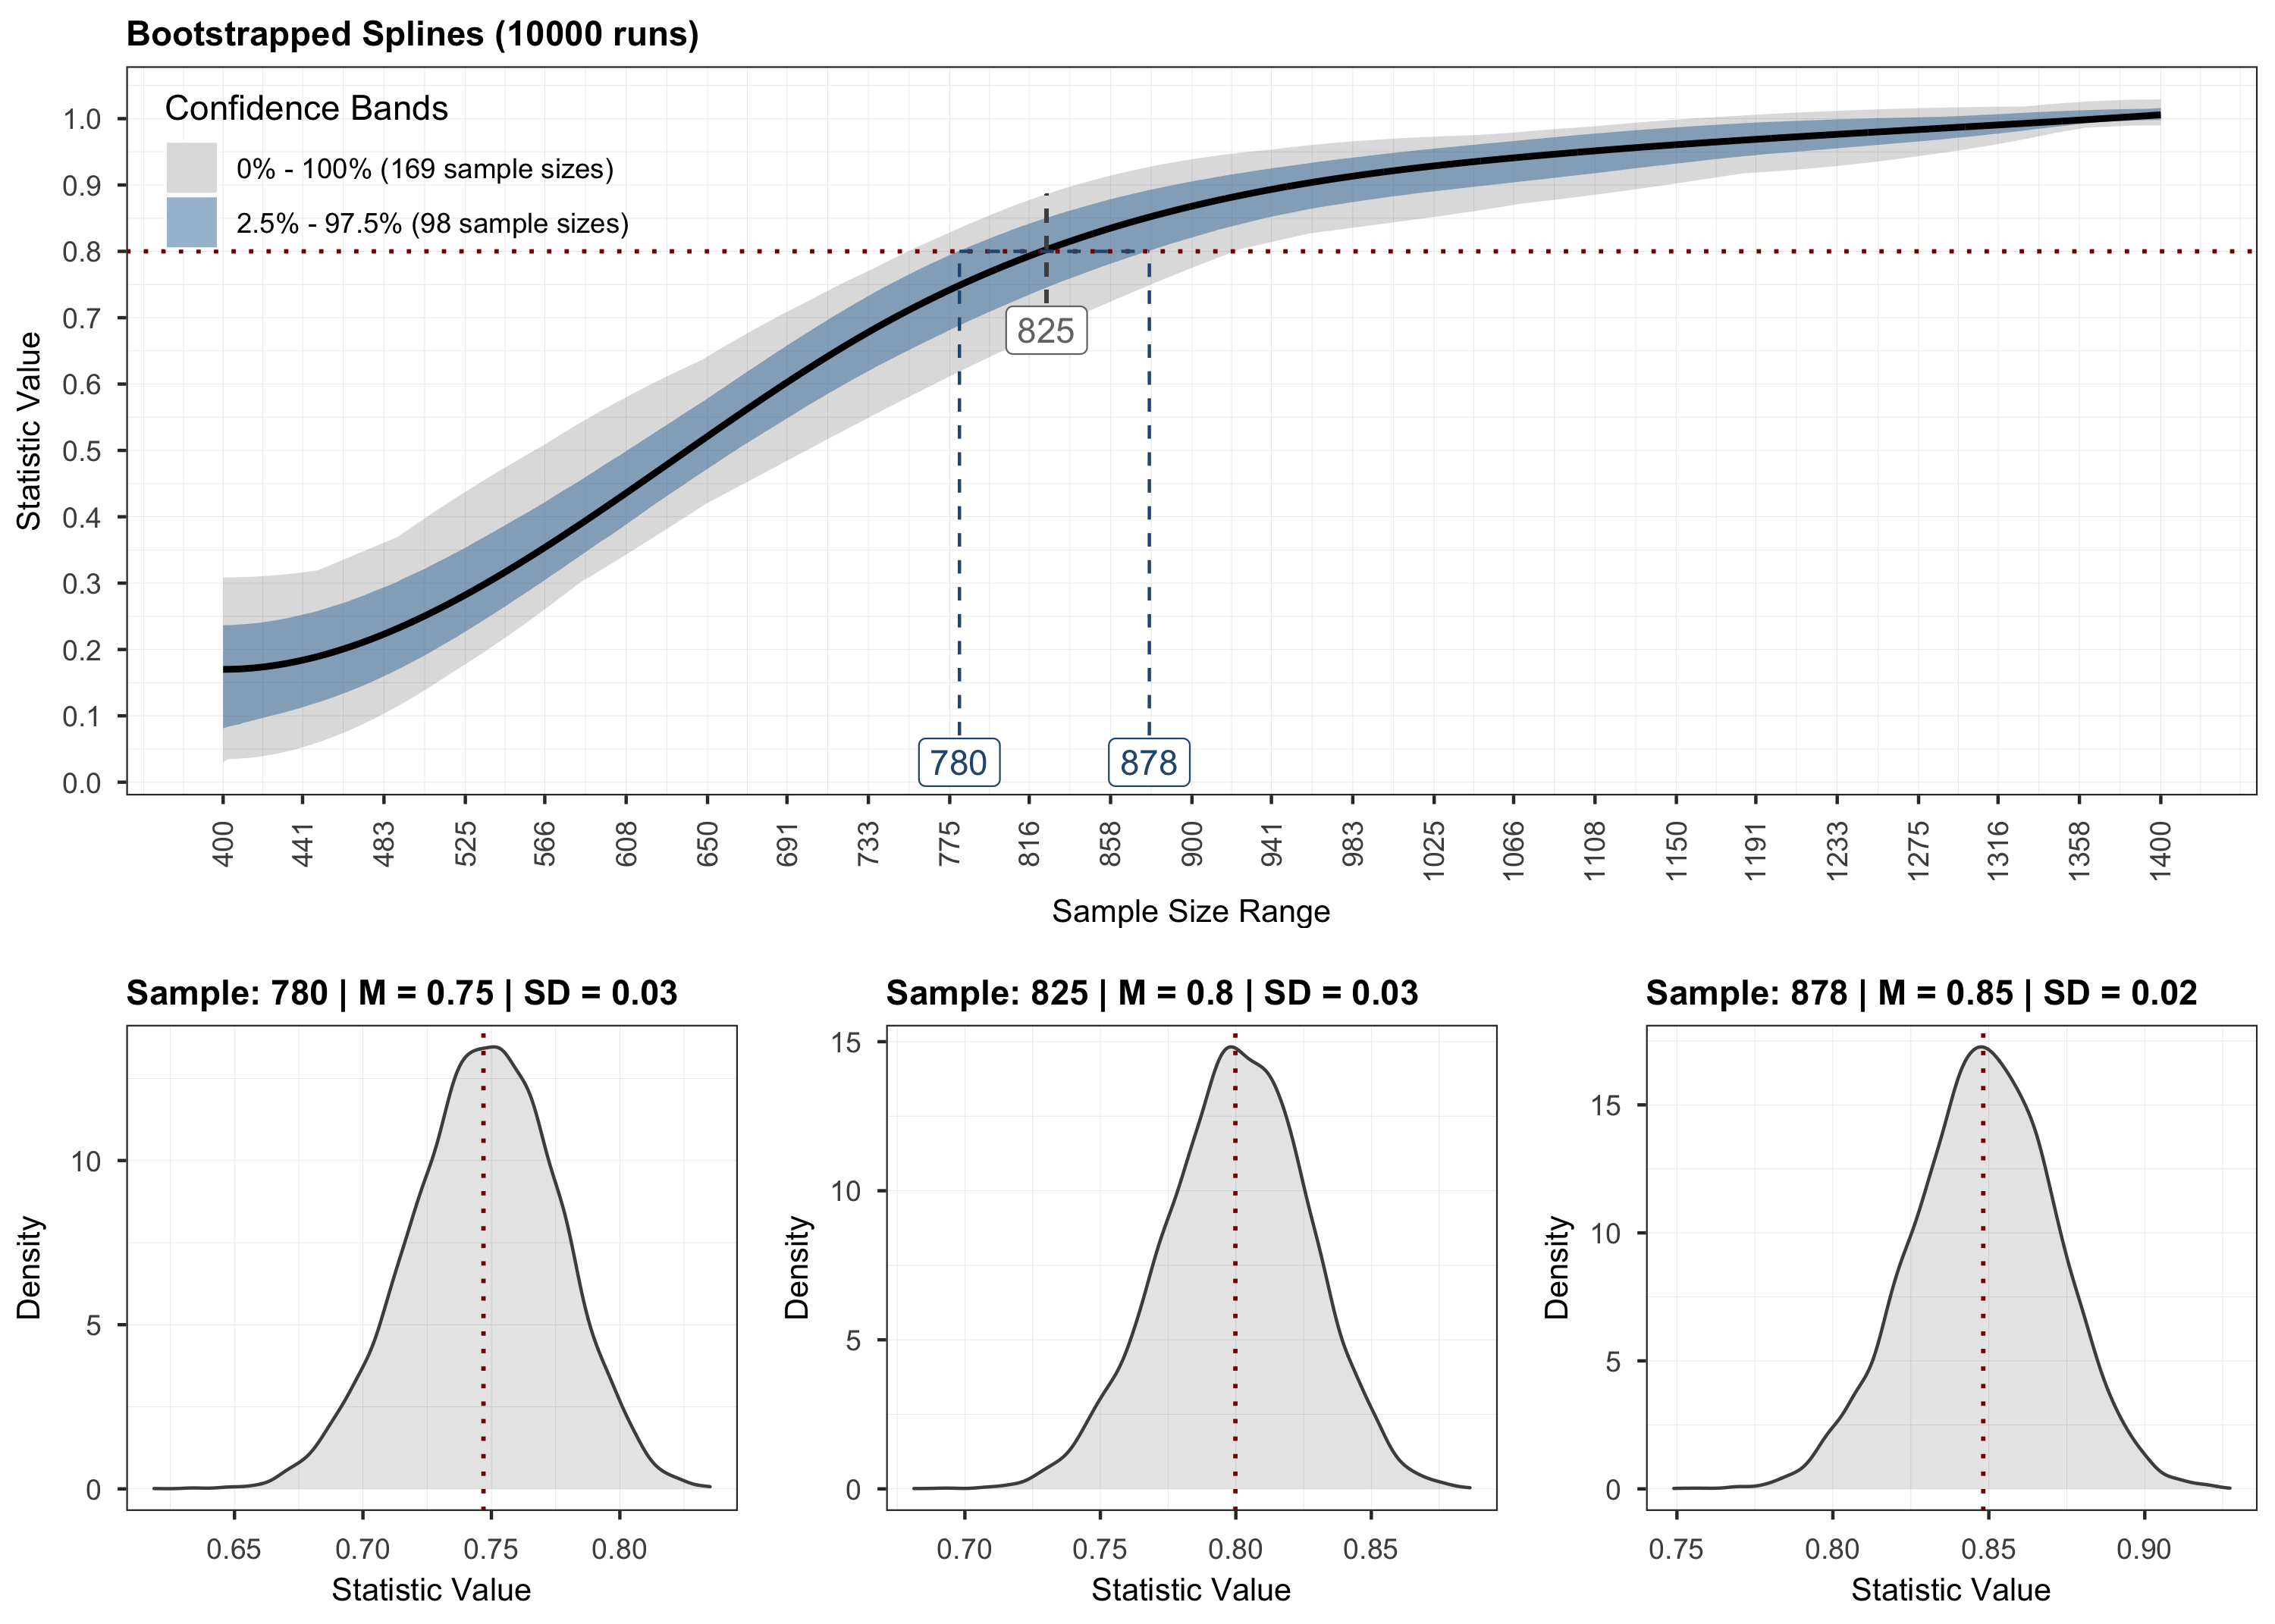
step for interpolating the outcome. The final step employs stratified
bootstrapping to quantify the uncertainty around the fitted curve.
Check out the documentation and tutorials at
<h3>
    <a href="https://powerly.dev">powerly.dev</a>
</h3>install.packages("powerly")remotes::install_github("mihaiconstantin/powerly")The code block below illustrates the main function in the package.
For more information, see the documentation ?powerly, or
check out the tutorials at powerly.dev.
# Suppose we want to find the sample size for observing a sensitivity of `0.6`
# with a probability of `0.8`, for a GGM true model consisting of `10` nodes
# with a density of `0.4`.
# We can run the method for an arbitrarily generated true model that matches
# those characteristics (i.e., number of nodes and density).
results <- powerly(
range_lower = 300,
range_upper = 1000,
samples = 30,
replications = 20,
measure = "sen",
statistic = "power",
measure_value = .6,
statistic_value = .8,
model = "ggm",
nodes = 10,
density = .4,
cores = 2,
verbose = TRUE
)
# Or we omit the `nodes` and `density` arguments and specify directly the edge
# weights matrix via the `model_matrix` argument.
# To get a matrix of edge weights we can use the `generate_model()` function.
true_model <- generate_model(type = "ggm", nodes = 10, density = .4)
# Then, supply the true model to the algorithm directly.
results <- powerly(
range_lower = 300,
range_upper = 1000,
samples = 30,
replications = 20,
measure = "sen",
statistic = "power",
measure_value = .6,
statistic_value = .8,
model = "ggm",
model_matrix = true_model, # Note the change.
cores = 2,
verbose = TRUE
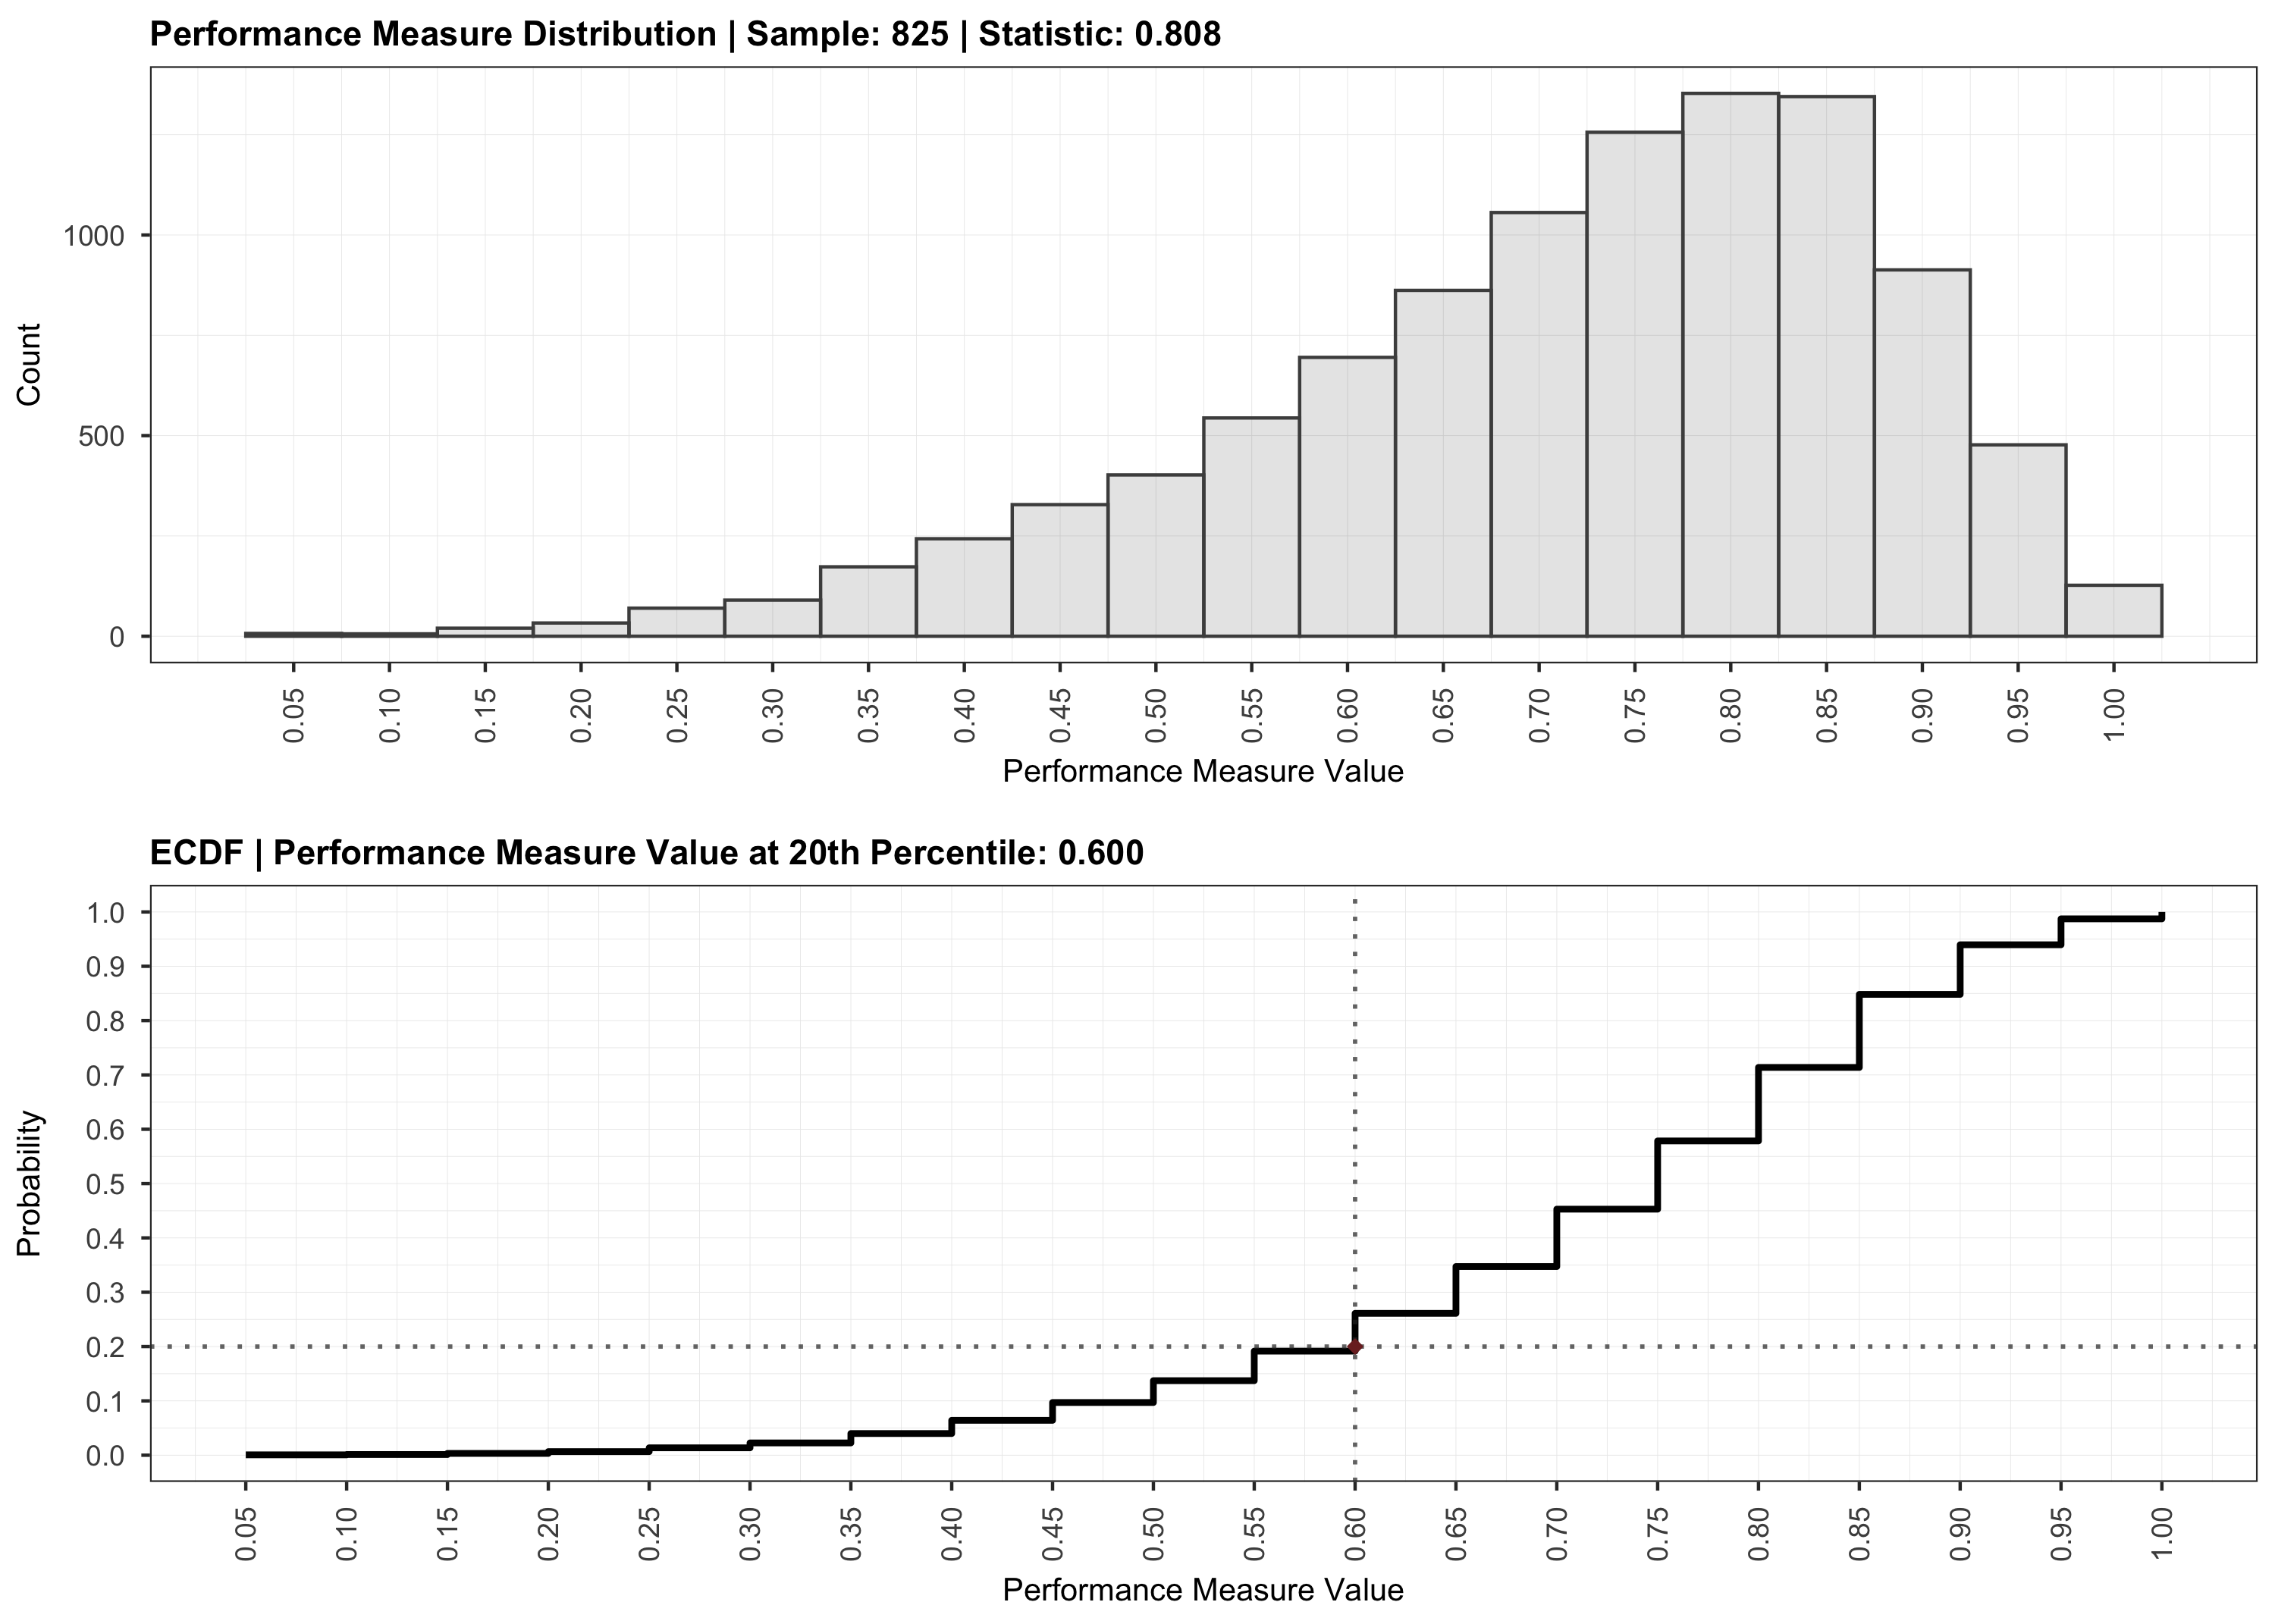
)To validate the results of the analysis, we can use the
validate() method. For more information, see the
documentation ?validate.
# Validate the recommendation obtained during the analysis.
validation <- validate(results, cores = 2)
To visualize the results, we can use the plot function
and indicate the step that should be plotted.
# Step 1.
plot(results, step = 1)
# Step 2.
plot(results, step = 2)
# Step 3.
plot(results, step = 3)
# Validation.
plot(validation)

The code in this repository is licensed under the MIT license.
To use powerly please cite:
These binaries (installable software) and packages are in development.
They may not be fully stable and should be used with caution. We make no claims about them.
Health stats visible at Monitor.