The hardware and bandwidth for this mirror is donated by dogado GmbH, the Webhosting and Full Service-Cloud Provider. Check out our Wordpress Tutorial.
If you wish to report a bug, or if you are interested in having us mirror your free-software or open-source project, please feel free to contact us at mirror[@]dogado.de.
The poems package provides a framework of interoperable R6 (Chang, 2020) classes for building ensembles of viable models via the pattern-oriented modeling (POM) approach (Grimm et al., 2005). Pattern-oriented modeling is a vigorous form of statistical validation in which simulations and their parameter settings are summarized using key metrics and converged toward multiple observed patterns, or targets.
The package provides a process-based population model related to the functionality of RAMAS or Vortex, but in a free and open source format, with high customizability. The package includes classes for encapsulating and generating model parameters, and managing the POM workflow. The workflow includes:
By default, model validation and selection utilizes an approximate Bayesian computation (ABC) approach (Beaumont et al., 2002) using the abc package (Csillery et al., 2015). However, alternative user-defined functionality could be employed.
The package includes a spatially explicit demographic population model simulation engine, which incorporates default functionality for density dependence, correlated environmental stochasticity, stage-based transitions, and distance-based dispersal. The user may customize the simulator by defining functionality for translocations, harvesting, mortality, and other processes, as well as defining the sequence order for the simulator processes. The framework could also be adapted for use with other model simulators by utilizing its extendable (inheritable) base classes.
You can install poems from the CRAN repository:
install.packages("poems")Or you can install the development version of poems from GitHub using:
# install.packages("devtools")
remotes::install_github("GlobalEcologyLab/poems")poems can do spatial population models on its own, but
it also provides the engine behind two extension packages: paleopop and epizootic.
paleopop is an extension for simulating populations over
very long timescales, and epizootic is an extension for
simulating disease dynamics in wild populations.
The following simple example demonstrates how to run a single spatially explicit demographic population model using poems:
library(poems)

# Demonstration example region (U Island) and initial abundance
coordinates <- data.frame(
  x = rep(seq(177.01, 177.05, 0.01), 5),
  y = rep(seq(-18.01, -18.05, -0.01), each = 5)
)
template_raster <- Region$new(coordinates = coordinates)$region_raster # full extent
template_raster[][-c(7, 9, 12, 14, 17:19)] <- NA # make U Island
region <- Region$new(template_raster = template_raster)
initial_abundance <- seq(0, 300, 50)
raster::plot(region$raster_from_values(initial_abundance),
  main = "Initial abundance", xlab = "Longitude (degrees)",
  ylab = "Latitude (degrees)", zlim = c(0, 300), colNA = "blue"
)
# Set population model
pop_model <- PopulationModel$new(
  region = region,
  time_steps = 5,
  populations = 7,
  initial_abundance = initial_abundance,
  stage_matrix = matrix(c(
    0, 2.5, # Leslie/Lefkovitch matrix
    0.8, 0.5
  ), nrow = 2, ncol = 2, byrow = TRUE),
  carrying_capacity = rep(200, 7),
  density_dependence = "logistic",
  dispersal = (!diag(nrow = 7, ncol = 7)) * 0.05,
  result_stages = c(1, 2)
)

# Run single simulation
results <- population_simulator(pop_model)
results # examine
#> $all
#> $all$abundance
#> [1] 1010 1077 1229 1288 1405
#>
#> $all$abundance_stages
#> $all$abundance_stages[[1]]
#> [1] 604 615 761 744 841
#>
#> $all$abundance_stages[[2]]
#> [1] 406 462 468 544 564
#>
#>
#>
#> $abundance
#>      [,1] [,2] [,3] [,4] [,5]
#> [1,]   50   91  143  174  204
#> [2,]   91  139  167  190  204
#> [3,]  126  136  162  201  196
#> [4,]  161  159  175  195  193
#> [5,]  185  181  182  170  202
#> [6,]  195  189  195  174  198
#> [7,]  202  182  205  184  208
#>
#> $abundance_stages
#> $abundance_stages[[1]]
#>      [,1] [,2] [,3] [,4] [,5]
#> [1,]   33   54   90  107  134
#> [2,]   56   83  100  113  126
#> [3,]   64   79   98  111  103
#> [4,]  102   82  110  115  114
#> [5,]  100  113  109  103  118
#> [6,]  125  107  118   88  126
#> [7,]  124   97  136  107  120
#>
#> $abundance_stages[[2]]
#>      [,1] [,2] [,3] [,4] [,5]
#> [1,]   17   37   53   67   70
#> [2,]   35   56   67   77   78
#> [3,]   62   57   64   90   93
#> [4,]   59   77   65   80   79
#> [5,]   85   68   73   67   84
#> [6,]   70   82   77   86   72
#> [7,]   78   85   69   77   88
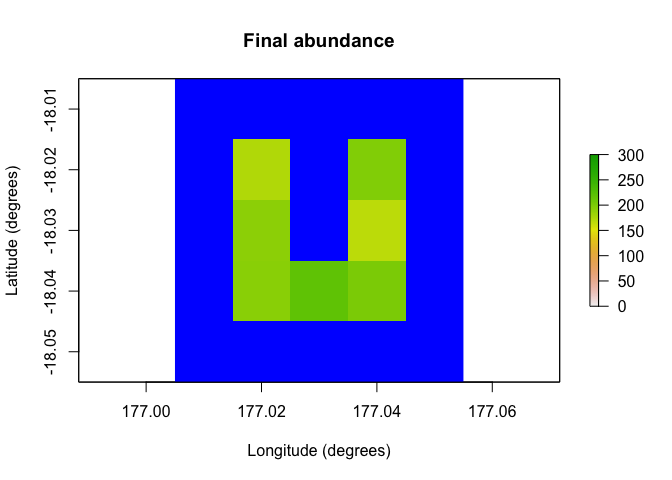
raster::plot(region$raster_from_values(results$abundance[, 5]),
  main = "Final abundance", xlab = "Longitude (degrees)",
  ylab = "Latitude (degrees)", zlim = c(0, 300), colNA = "blue"
)
Further examples utilizing the POM workflow and more advanced features of poems can be found in the accompanying vignettes.
You may cite poems in publications using our software paper in Methods in Ecology and Evolution:
Fordham, D. A., Haythorne, S., Brown, S. C., Buettel, J. C., & Brook, B. W. (2021). poems: R package for simulating species’ range dynamics using pattern‐oriented validation. Methods in Ecology and Evolution, 12(12), 2364-2371.
Beaumont, M. A., Zhang, W., & Balding, D. J. (2002). ‘Approximate Bayesian computation in population genetics’. Genetics, vol. 162, no. 4, pp, 2025–2035. doi:10.1093/genetics/162.4.2025
Chang, W. (2020). ‘R6: Encapsulated Classes with Reference Semantics’. R package version 2.5.0. Retrieved from https://CRAN.R-project.org/package=R6
Csillery, K., Lemaire L., Francois O., & Blum M. (2015). ‘abc: Tools for Approximate Bayesian Computation (ABC)’. R package version 2.1. Retrieved from https://CRAN.R-project.org/package=abc
Grimm, V., Revilla, E., Berger, U., Jeltsch, F., Mooij, W. M., Railsback, S. F., Thulke, H. H., Weiner, J., Wiegand, T., DeAngelis, D. L., (2005). ‘Pattern-Oriented Modeling of Agent-Based Complex Systems: Lessons from Ecology’. Science vol. 310, no. 5750, pp. 987–991. doi:10.1126/science.1116681
Iman R. L., Conover W. J. (1980). ‘Small sample sensitivity analysis techniques for computer models, with an application to risk assessment’. Commun Stat Theor Methods A9, pp. 1749–1842. doi:10.1080/03610928008827996
These binaries (installable software) and packages are in development.
They may not be fully stable and should be used with caution. We make no claims about them.
Health stats visible at Monitor.