The hardware and bandwidth for this mirror is donated by dogado GmbH, the Webhosting and Full Service-Cloud Provider. Check out our Wordpress Tutorial.
If you wish to report a bug, or if you are interested in having us mirror your free-software or open-source project, please feel free to contact us at mirror[@]dogado.de.
![]()
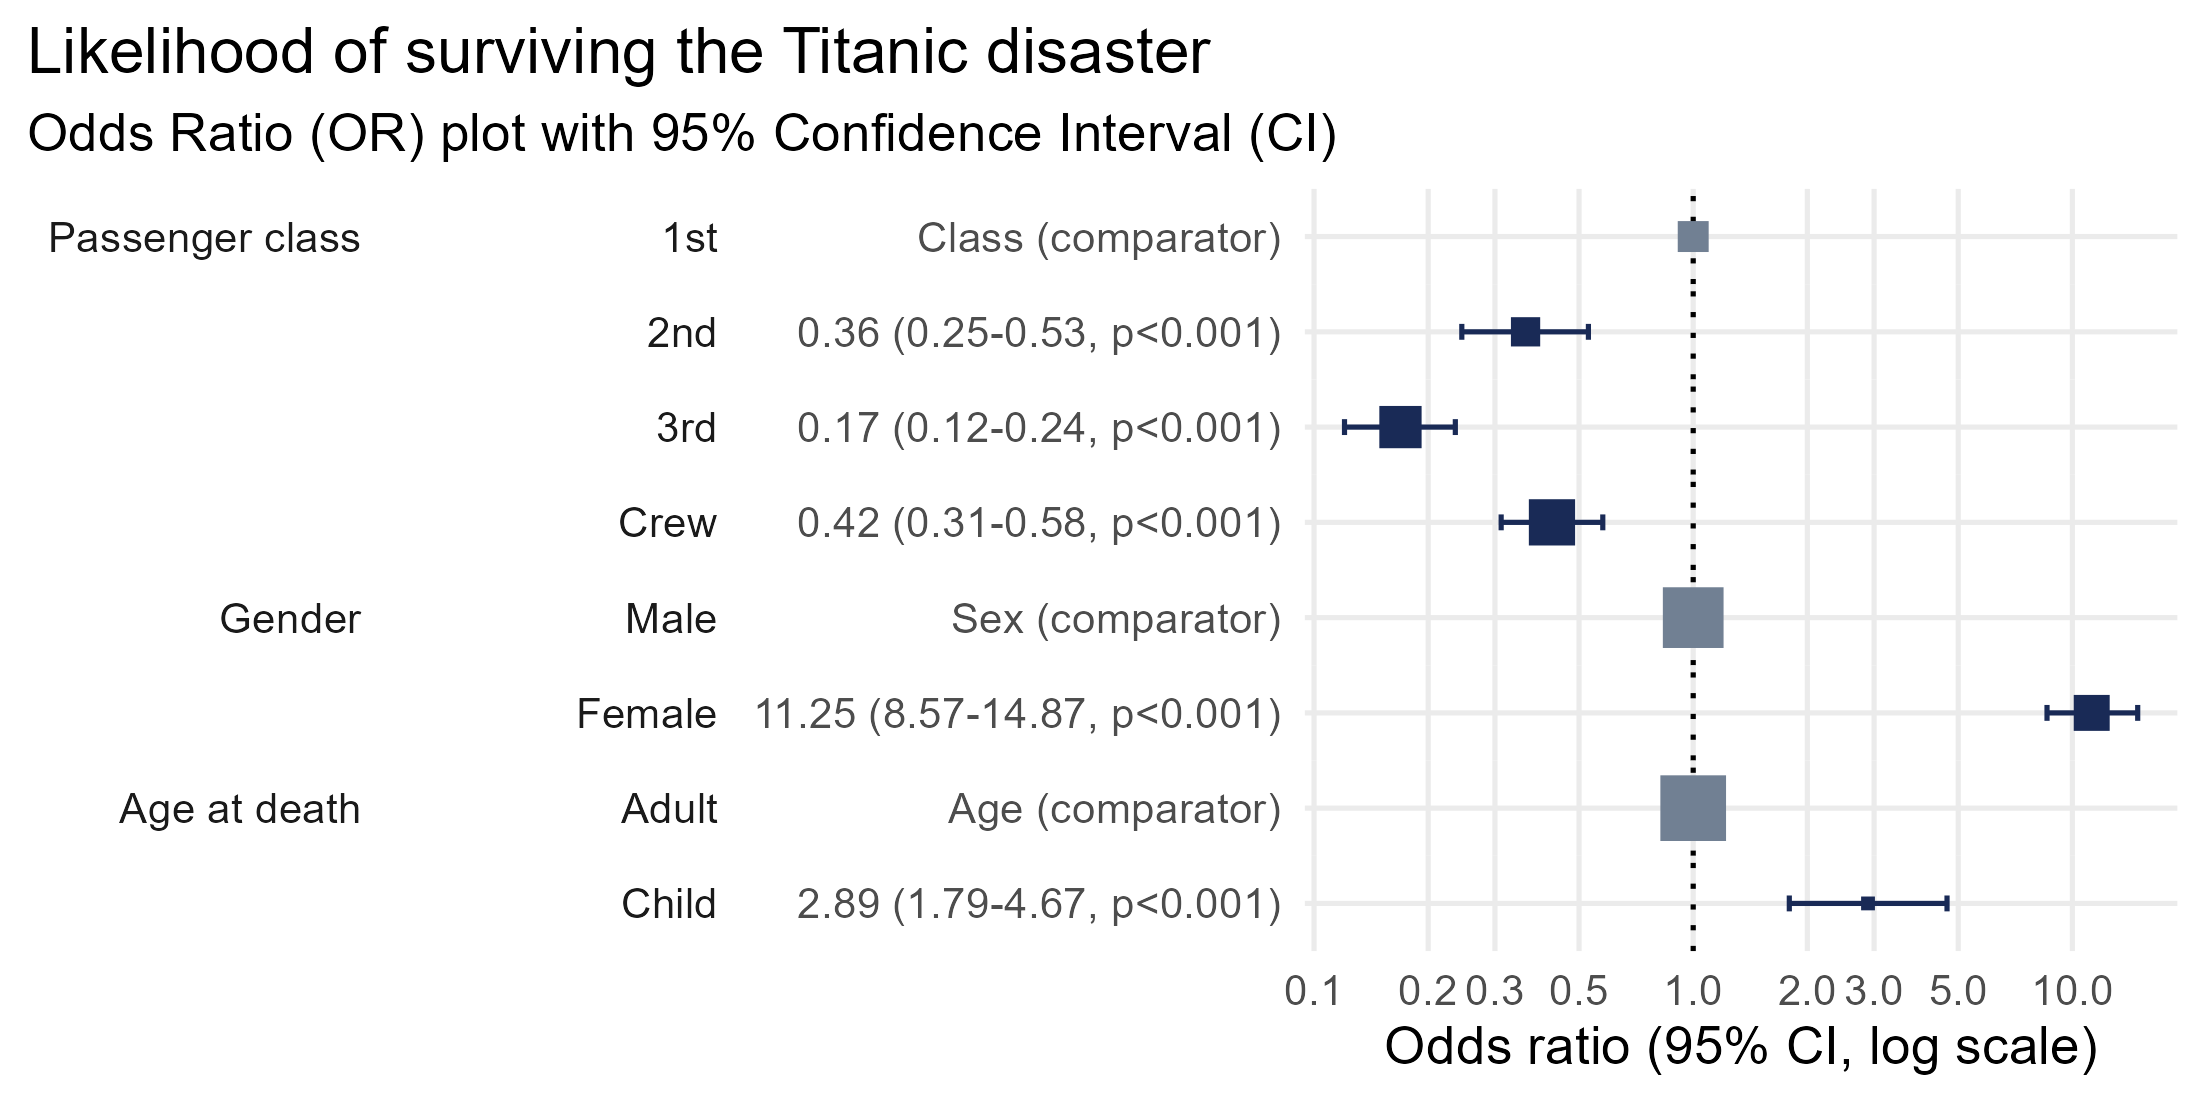
plotor makes it easy to generate clear, publication-ready odds-ratio plots and tables from logistic regression models.
If you work with binary outcomes, plotor helps you go from model → interpretation in seconds.
A single function call gives you a polished OR plot:
Perfect for reports and publications:
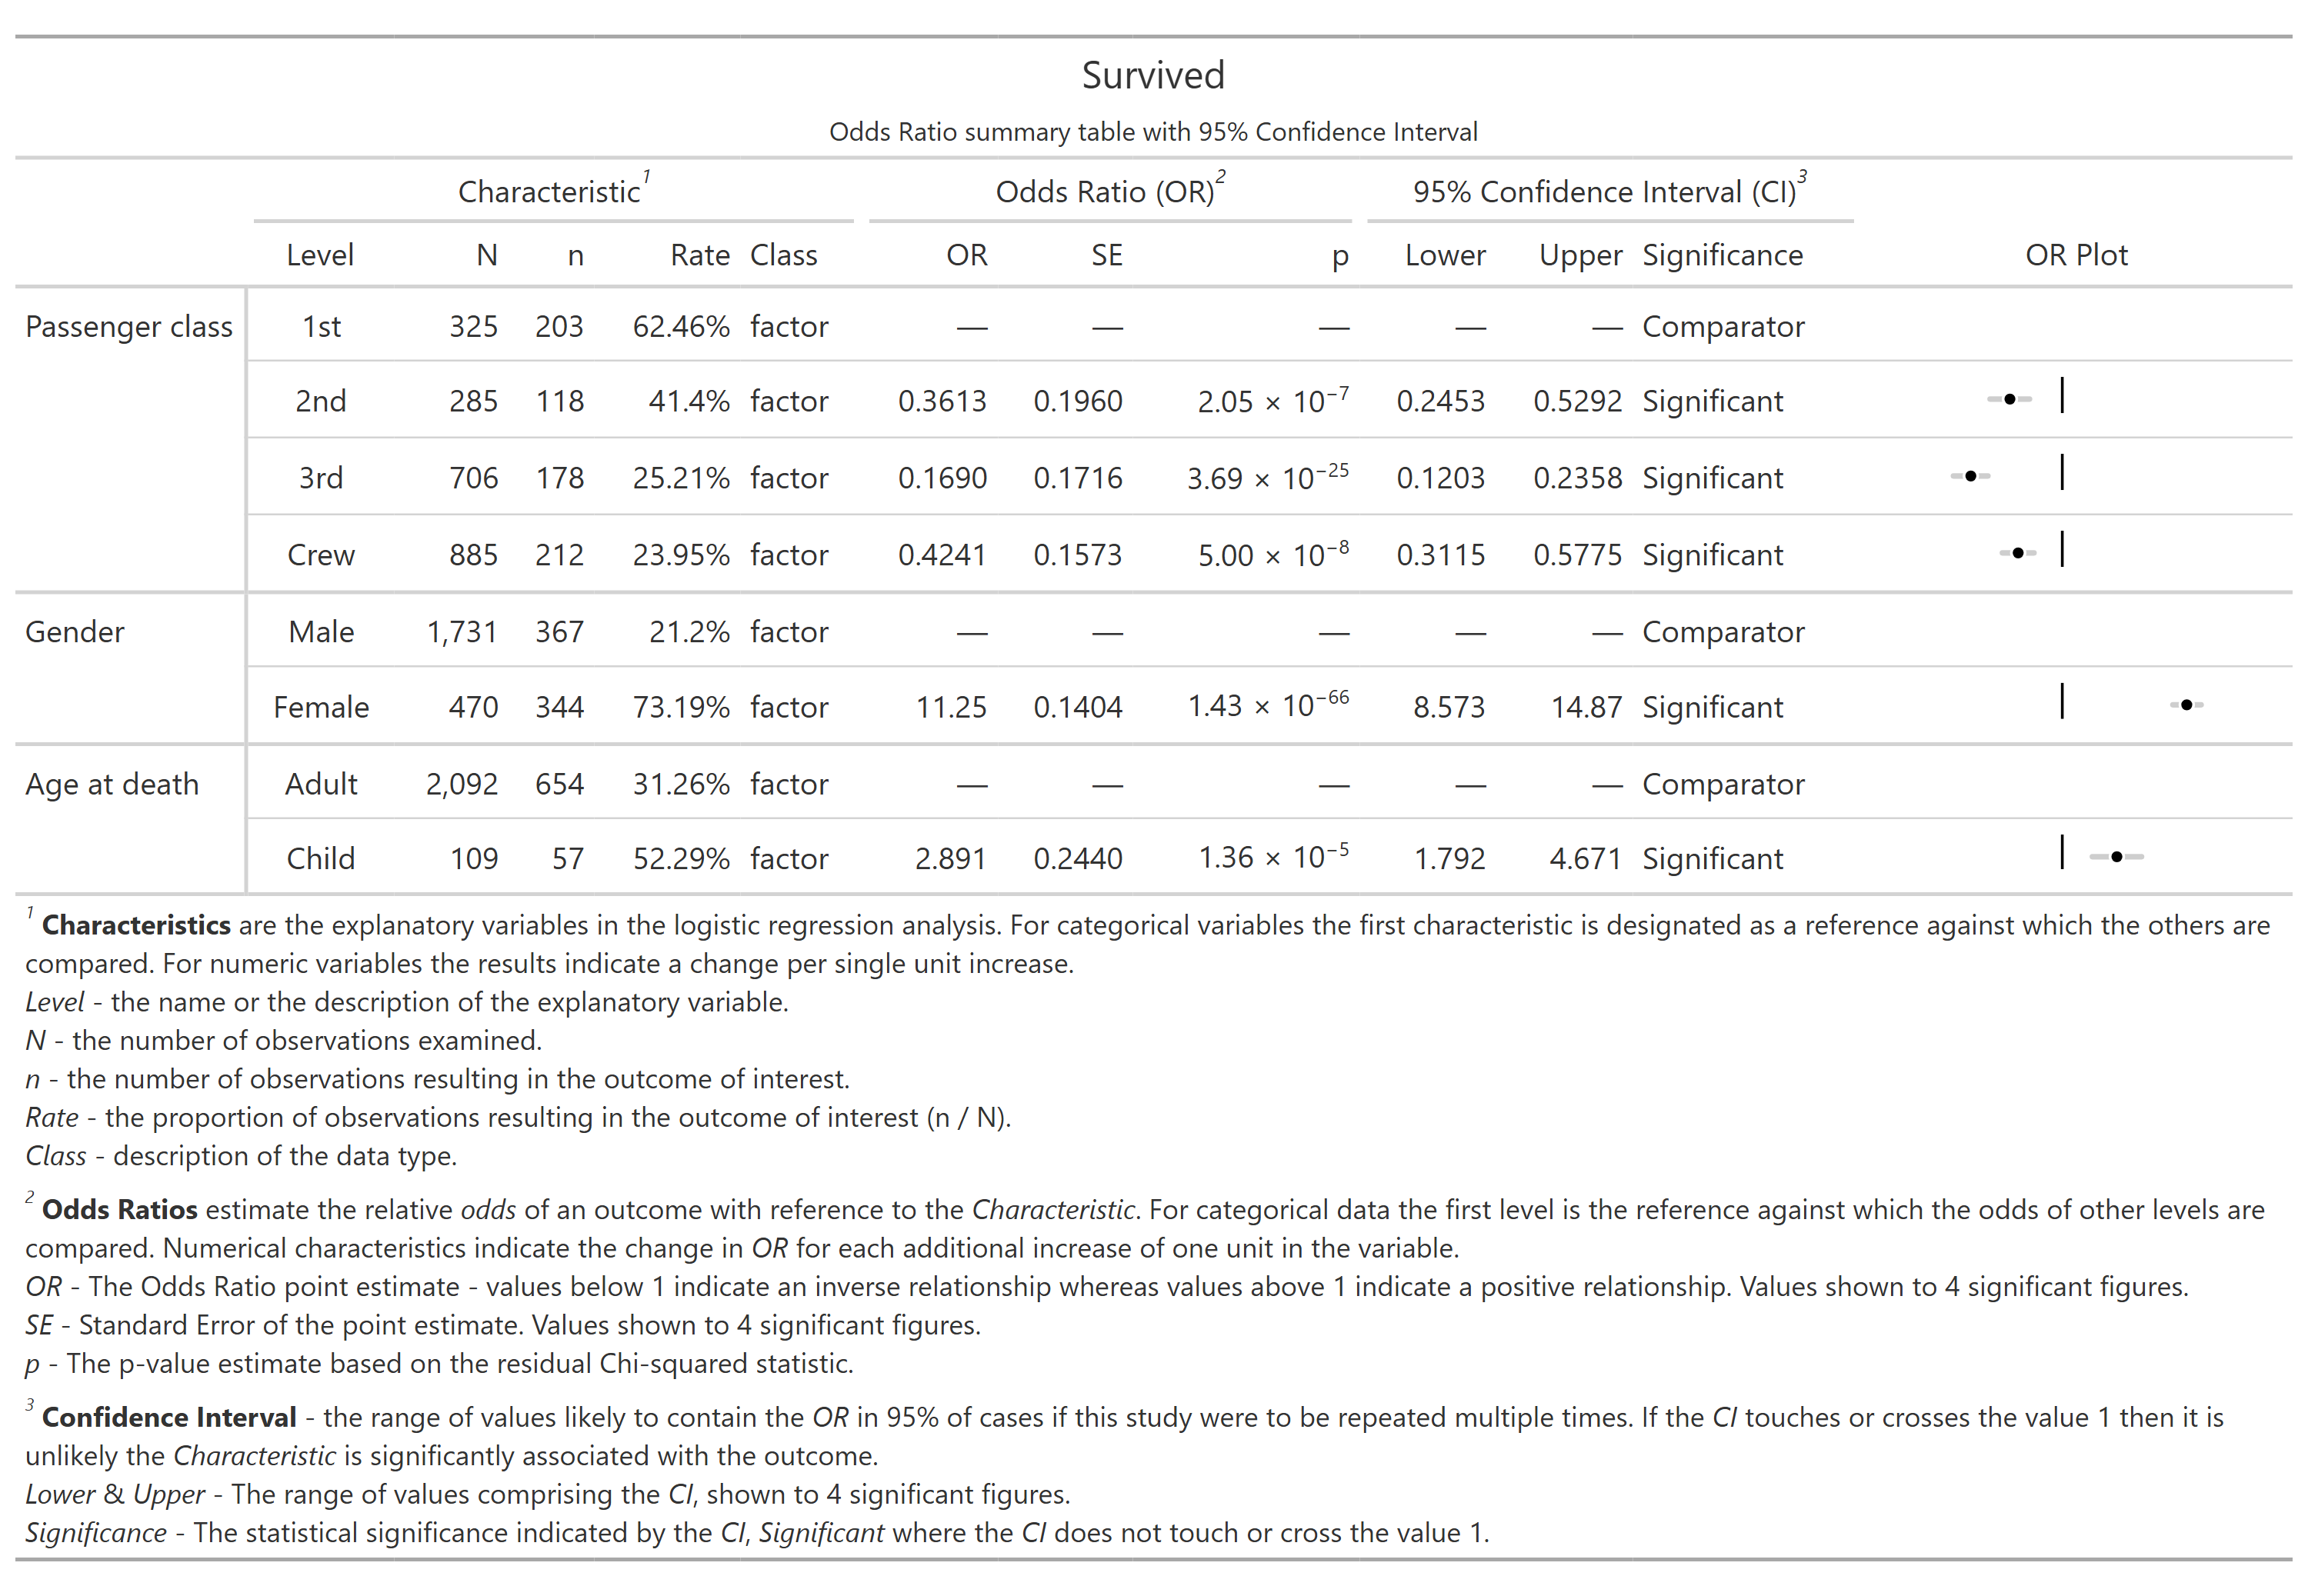
See full table output options →
plotor includes built-in checks to help validate your logistic regression model:
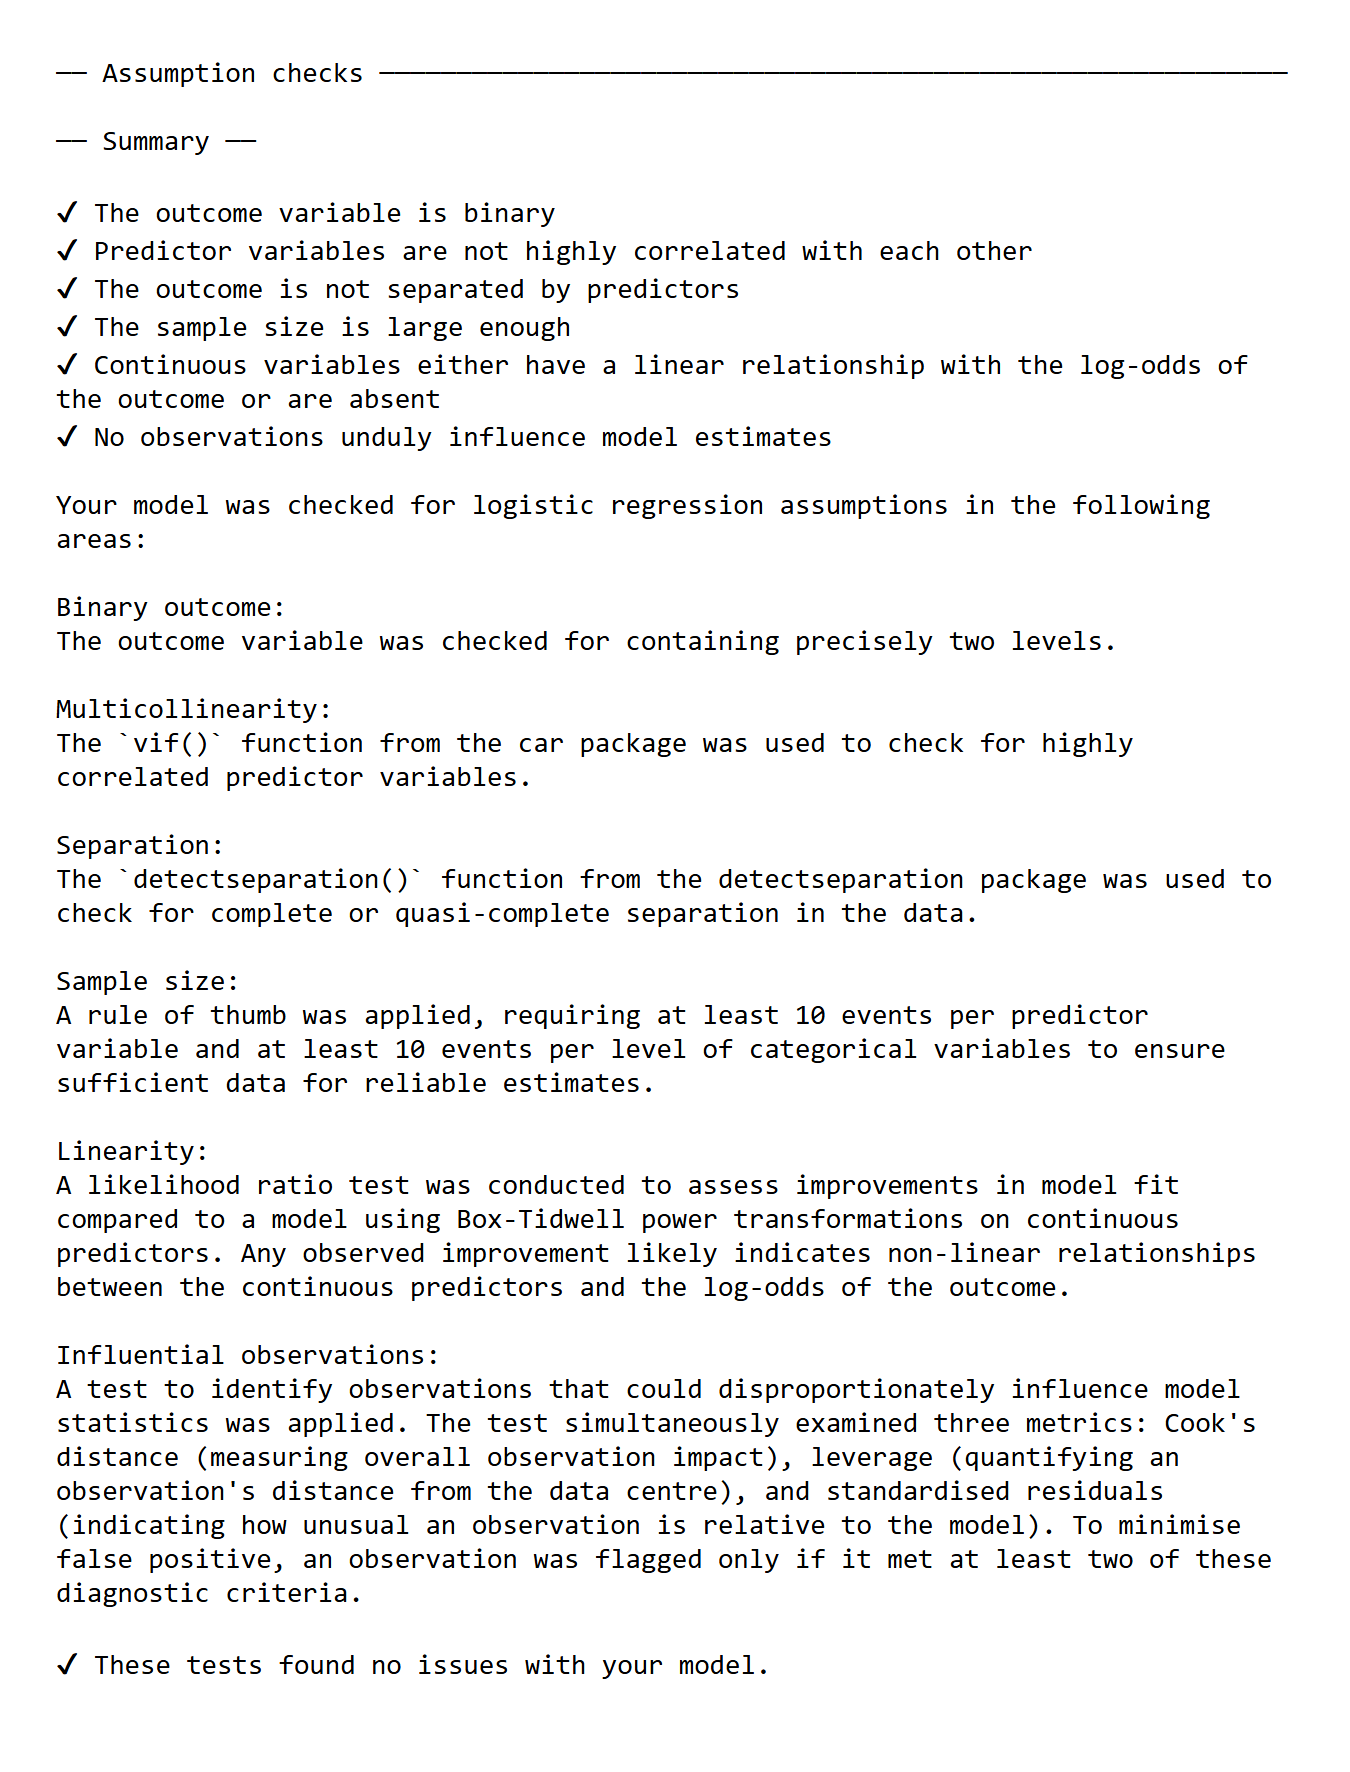
See full assumption check output →
Stable release (CRAN):
install.packages("plotor")Using {pak}:
# install.packages("pak")
pak::pak("plotor")
Development version:
# install.packages("pak")
pak::pak("craig-parylo/plotor")library(plotor)
# load the titanic dataset from the package
df_titanic <- get_df_titanic()
# make a logistic regression model using this data
model <- stats::glm(
data = df_titanic,
formula = Survived ~ Class + Sex + Age,
family = "binomial"
)
# plot the odds ratios
plot_or(model)?plot_or?table_or?check_orFull documentation: https://craig-parylo.github.io/plotor/
These binaries (installable software) and packages are in development.
They may not be fully stable and should be used with caution. We make no claims about them.
Health stats visible at Monitor.