The hardware and bandwidth for this mirror is donated by dogado GmbH, the Webhosting and Full Service-Cloud Provider. Check out our Wordpress Tutorial.
If you wish to report a bug, or if you are interested in having us mirror your free-software or open-source project, please feel free to contact us at mirror[@]dogado.de.
The plausibounds package implements the additions to
dynamic effect plots suggested in Freyaldenhoven
and Hansen (2026). Data-driven smoothing delivers a smooth estimated
path with potentially improved point estimation properties and
confidence regions covering a surrogate that can be substantially
tighter than conventional pointwise or uniform bands.
# Install from CRAN
install.packages("plausibounds")

# Install latest version from GitHub
install.packages("devtools")
devtools::install_github("SimonFreyaldenhoven/plausibounds")Find a minimal example below. For more information see the package documentation and vignette.
library(plausibounds)
library(ggplot2)

set.seed(916)

# Load example data
data(estimates_bighump)
data(var_bighump)

# Compute restricted bounds for 1 year of estimates
pb <- plausible_bounds(
  estimates = estimates_bighump[1:12],
  var = var_bighump[1:12, 1:12]
)
# View results
summary(pb)
#> Summary of Plausible Bounds Results
#> -----------------------------------
#>
#> horizon unrestr_est restr_est restr_lower restr_upper
#> 1 -0.66903837 -0.66982871 -1.0365520 -0.30310545
#> 2 -0.66763389 -0.69318534 -1.0054594 -0.38091130
#> 3 -0.70083047 -0.62323523 -0.9264787 -0.31999175
#> 4 -0.46328837 -0.42801204 -0.6914514 -0.16457266
#> 5 -0.19787913 -0.19479113 -0.4171090 0.02752676
#> 6 0.01726552 -0.04222150 -0.2648770 0.18043404
#> 7 0.02363984 -0.02922778 -0.2539854 0.19552986
#> 8 -0.00735812 -0.03316318 -0.2561817 0.18985538
#> 9 0.17318567 -0.02993512 -0.2530062 0.19313599
#> 10 -0.05252205 -0.04318350 -0.2676068 0.18123976
#> 11 -0.22910158 -0.05518904 -0.2818020 0.17142388
#> 12 -0.09026334 -0.05172993 -0.2808989 0.17743903
# Visualize bounds
create_plot(pb)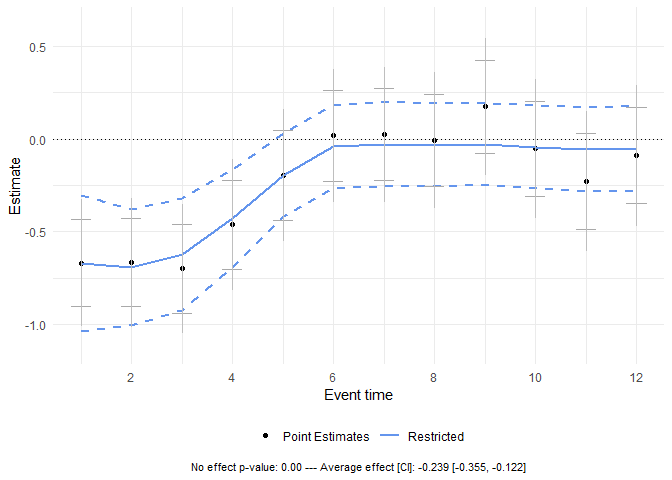
# Example with parallel processing
pb_parallel <- plausible_bounds(
  estimates = estimates_bighump,
  var = var_bighump,
  alpha = 0.05,
  parallel = TRUE,
  n_cores = 4
)Simon Freyaldenhoven, Christian Hansen. “(Visualizing) Plausible Treatment Effect Paths.” Federal Reserve Bank of Philadelphia and University of Chicago, 2026.
Simon Freyaldenhoven, Christian Hansen, Ryan Kobler.
“plausibounds package.” Code and data repository at https://github.com/SimonFreyaldenhoven/plausibounds,
2026.
These binaries (installable software) and packages are in development.
They may not be fully stable and should be used with caution. We make no claims about them.
Health stats visible at Monitor.