The hardware and bandwidth for this mirror is donated by dogado GmbH, the Webhosting and Full Service-Cloud Provider. Check out our Wordpress Tutorial.
If you wish to report a bug, or if you are interested in having us mirror your free-software or open-source project, please feel free to contact us at mirror[@]dogado.de.
News: This R package PBO is available on CRAN.
Implements in R some of the ideas found in the Bailey et al. paper
identified below. In particular we use combinatorially symmetric cross
validation (CSCV) to implement strategy performance tests evaluated by
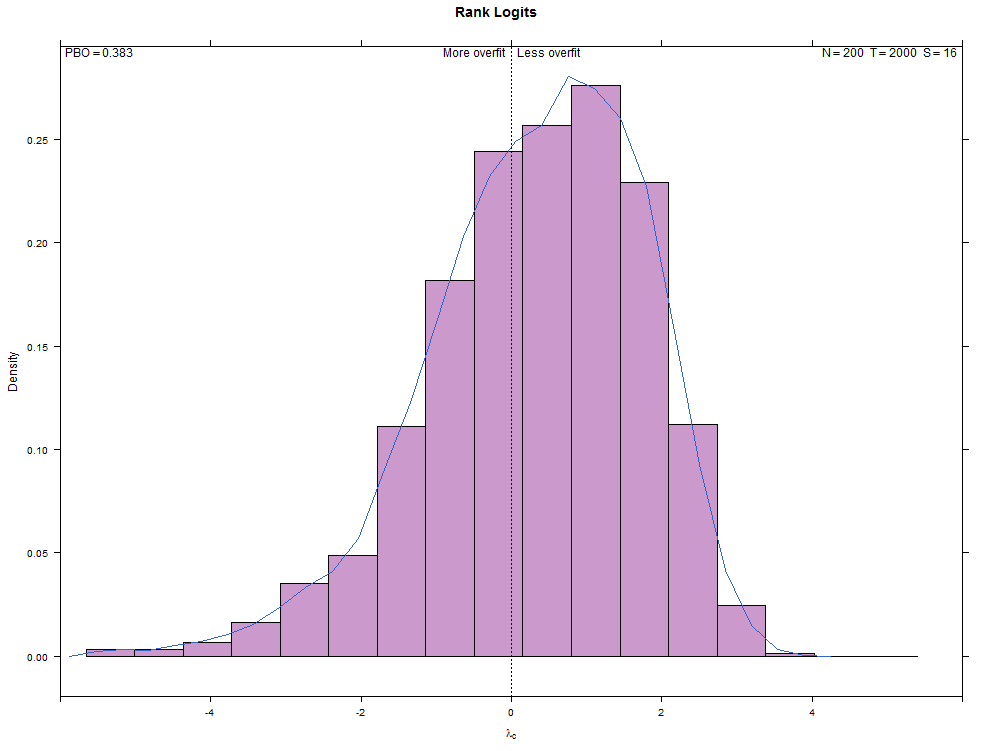
the Omega ratio. We compute the probability of backtest overfit,
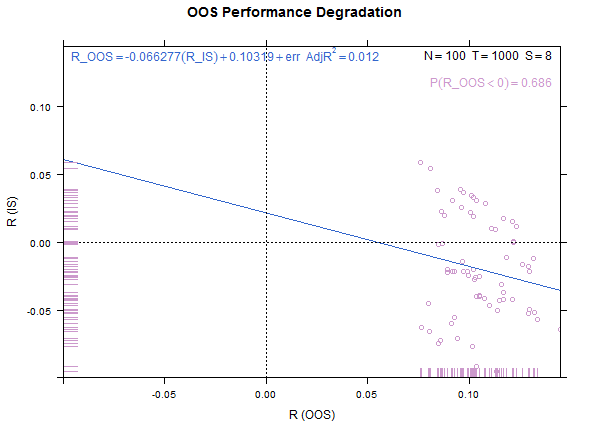
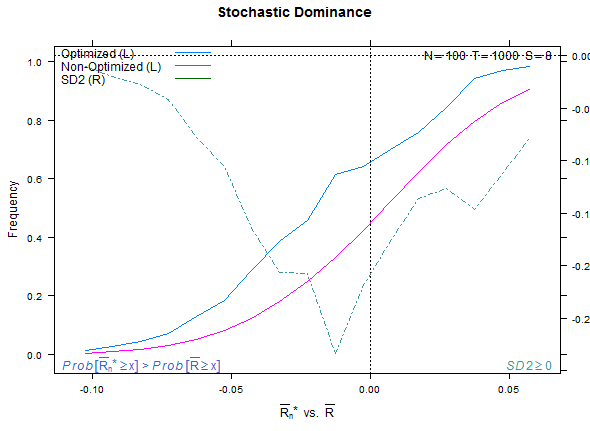
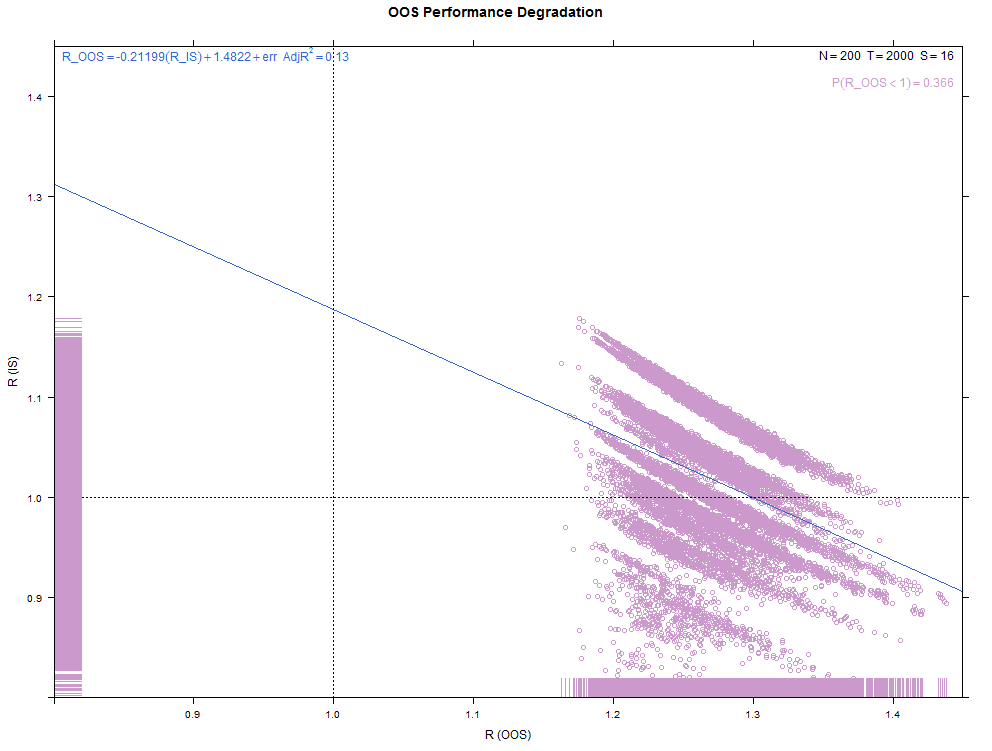
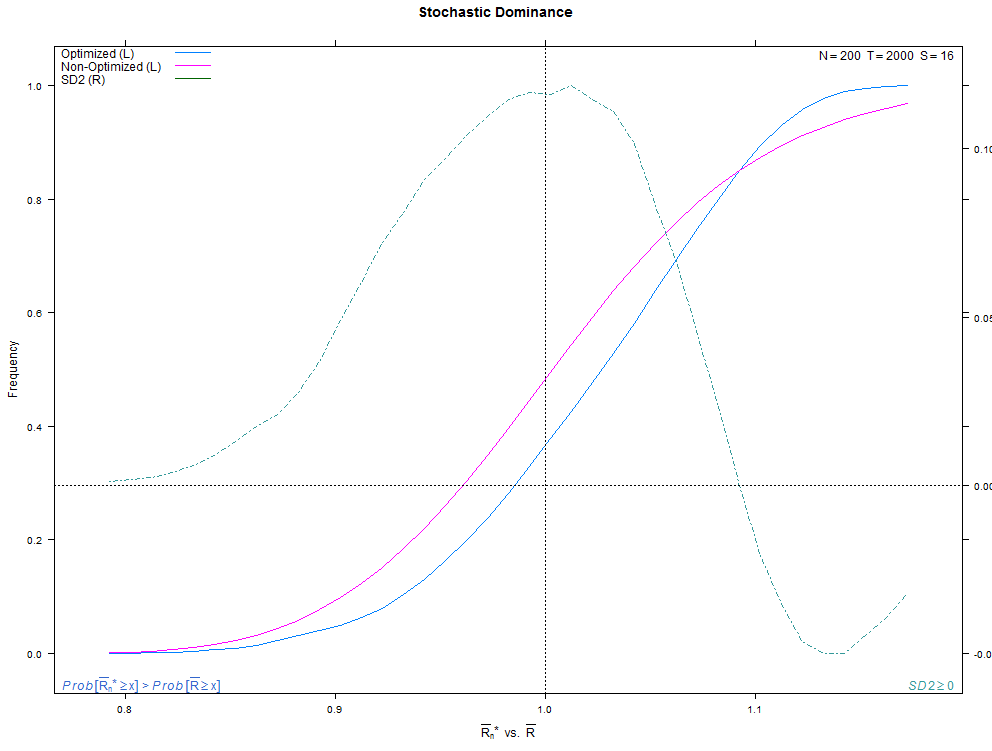
performance degradation, probability of loss, and stochastic dominance.
We plot visual representations of these using the lattice
package.
The reference authors used the Sharpe ratio as the performance measure. Other measures are suitable according to the assumptions laid out in the paper.
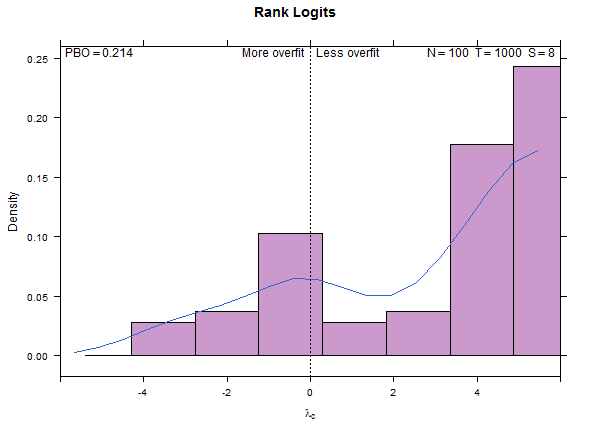
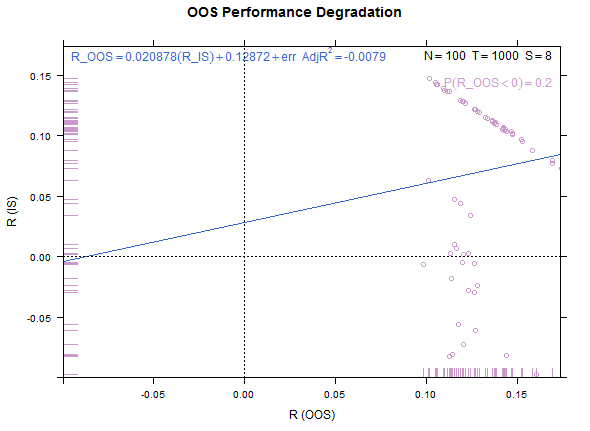
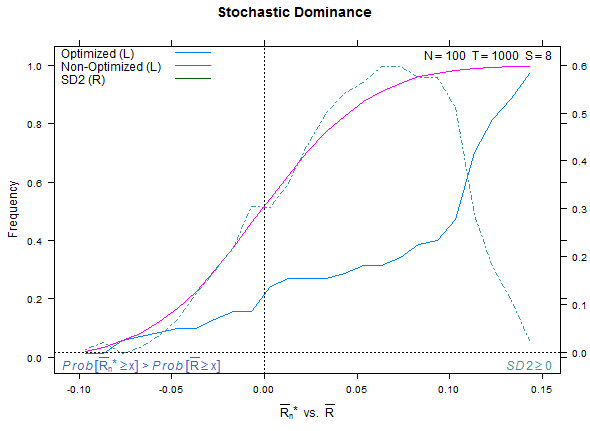
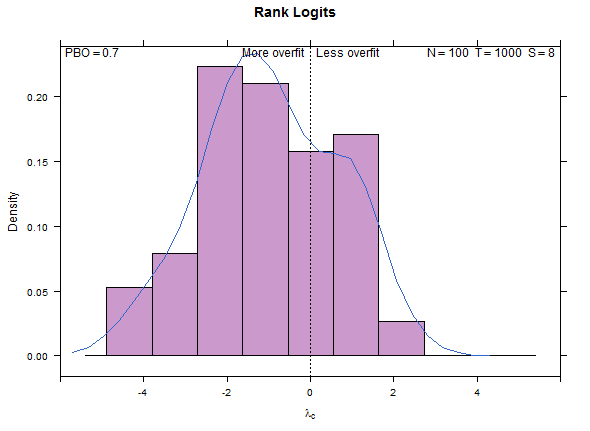
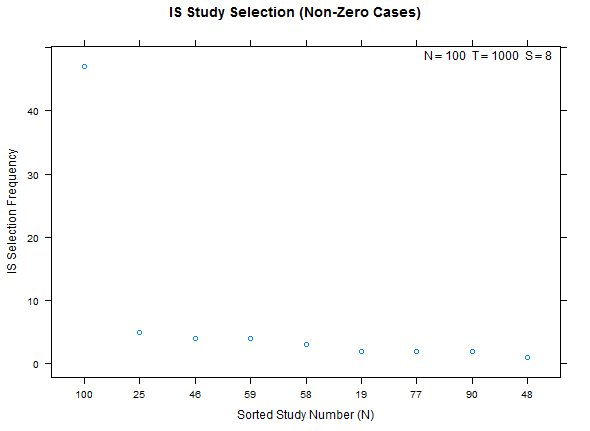
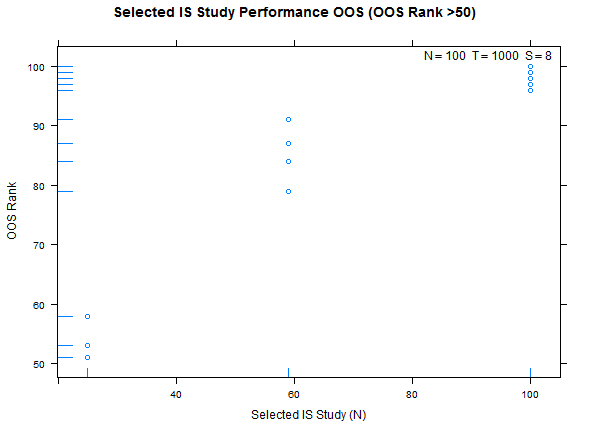
Example plots attached below. The first four illustrate a test with low overfitting (T-distribution, N=100, T=1600, S=8). The second four illustrate a test from the reference paper with high overfitting (normal distribution, N=100, T=1000, S=8). The third batch illustrate some study selection performance plots for both cases.
Example test case, low overfitting:


Reference test case 1, high overfitting:
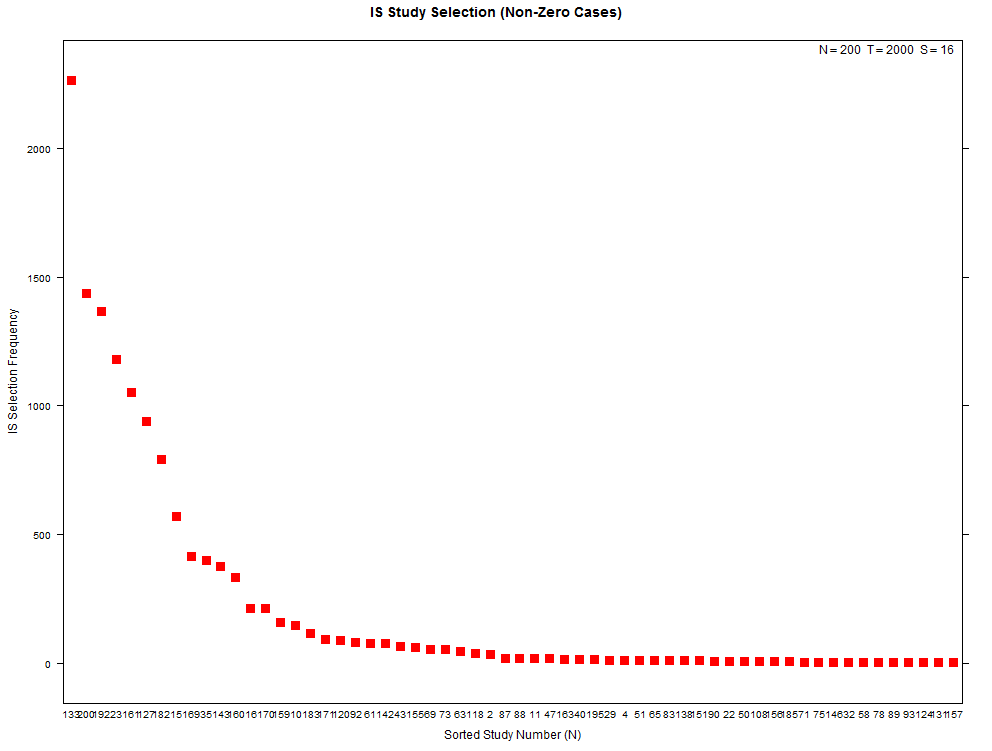
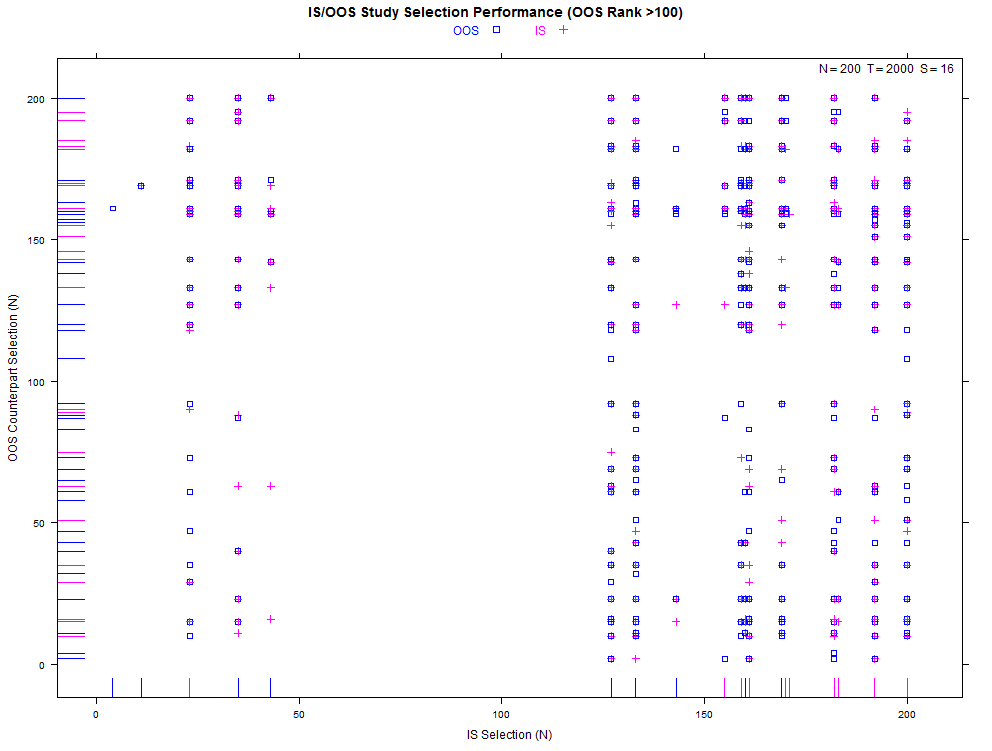
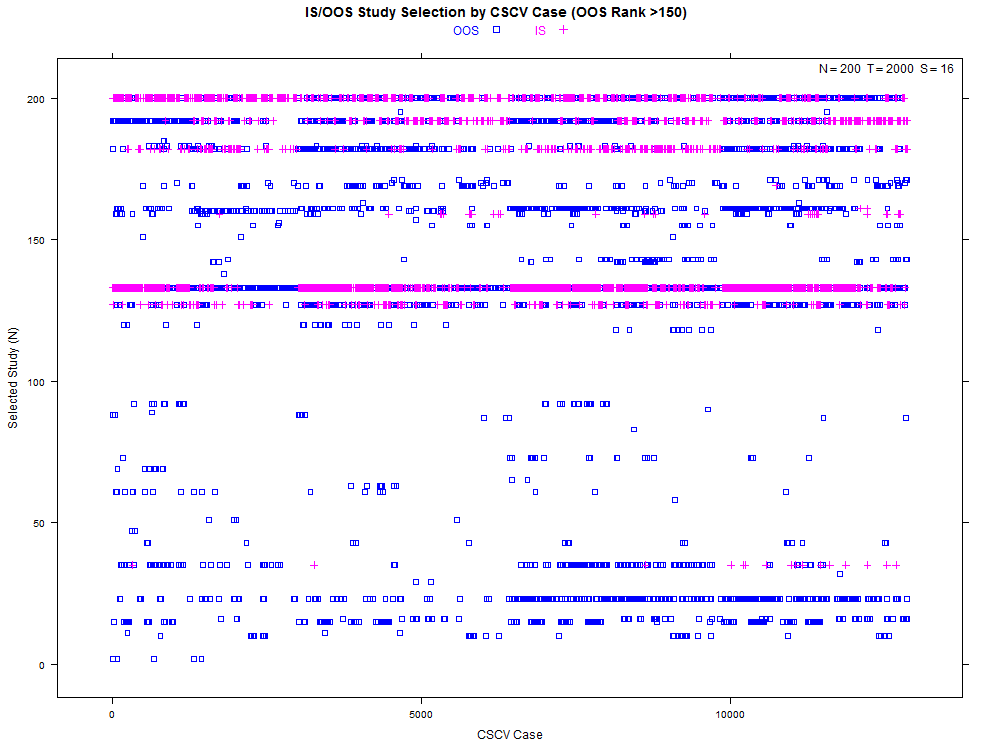
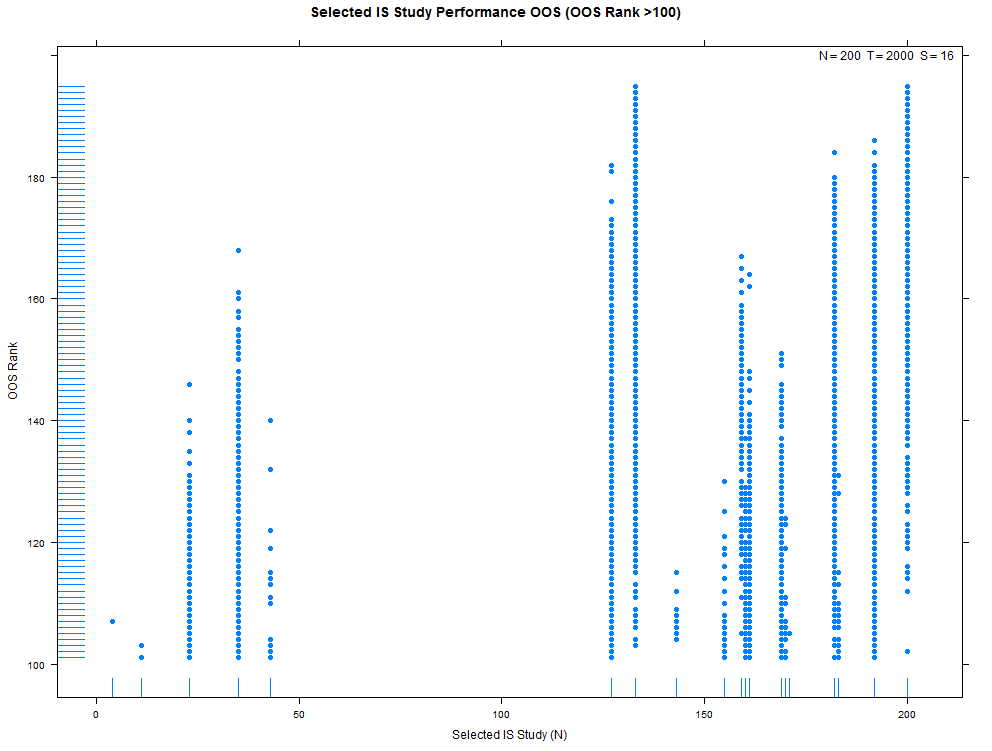
Example study selection performance for the low and high cases:
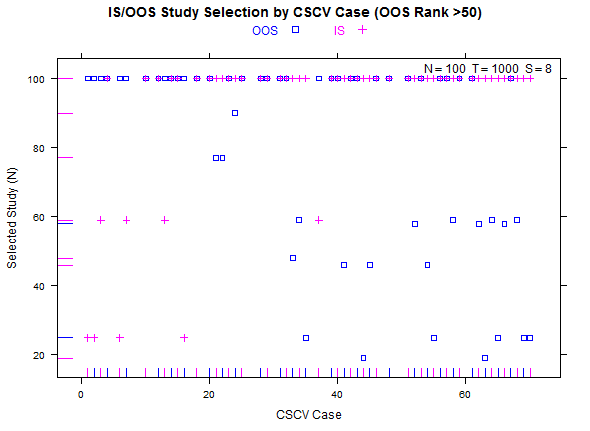
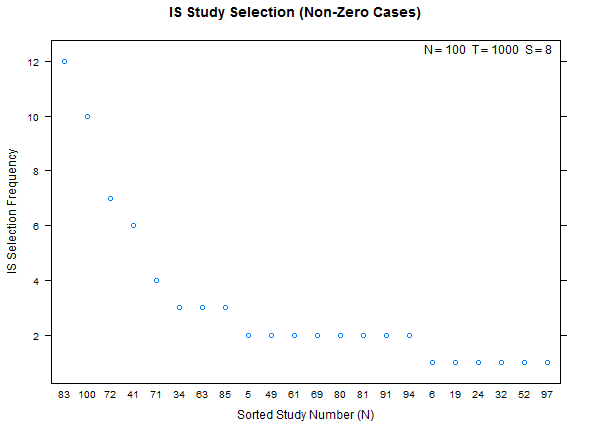
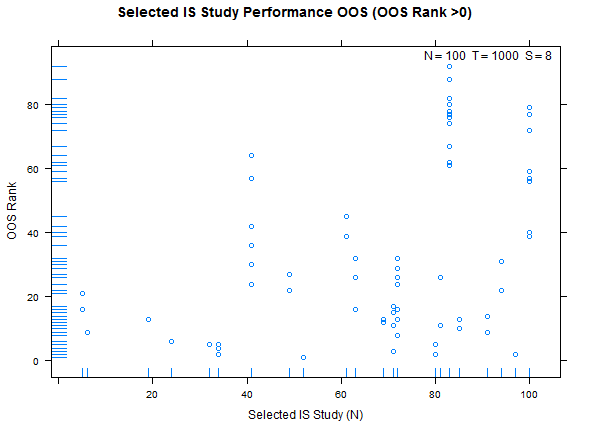
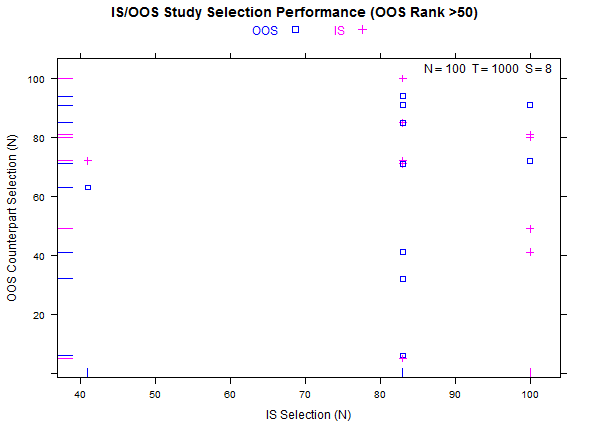
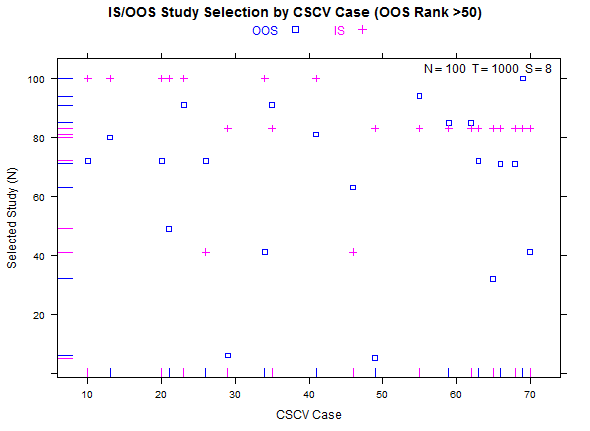
More examples with a larger number of combinations on the same high- and low-overfitting test cases. There are 12,780 CSCV combinations with the these tests (normal distribution, N=200, T=2000, S=16, Omega ratio performance).
require(devtools)
install_github('pbo',username='mrbcuda')require(pbo)
require(lattice) # for plots
require(PerformanceAnalytics) # for Omega ratio
N <- 200 # studies, alternative configurations
T <- 3200 # sample returns
S <- 8 # partition count
# load the matrix with samples for N alternatives
M <- data.frame(matrix(NA,T,N,byrow=TRUE,dimnames=list(1:T,1:N)),check.names=FALSE)
for ( i in 1:N ) M[,i] <- rt(T,10) / 100
# compute and plot
my_pbo <- pbo(M,S,F=Omega,threshold=1)
summary(my_pbo)
histogram(my_pbo)
dotplot(my_pbo,pch=15,col=2,cex=1.5)
xyplot(my_pbo,plotType="cscv",cex=0.8,show_rug=FALSE,osr_threshold=100)
xyplot(my_pbo,plotType="degradation")
xyplot(my_pbo,plotType="dominance",lwd=2)
xyplot(my_pbo,plotType="pairs",cex=1.1,osr_threshold=75)
xyplot(my_pbo,plotType="ranks",pch=16,cex=1.2)
xyplot(my_pbo,plotType="selection",sel_threshold=100,cex=1.2)require(pbo)
require(lattice)
require(PerformanceAnalytics)
require(doParallel) # for parallel processing
N = 200
T = 2000
S = 16
# create some phony trial data
sr_base = 0
mu_base = sr_base/(260.0)
sigma_base = 1.00/(260.0)**0.5
M <- data.frame(matrix(NA,T,N,byrow=TRUE,dimnames=list(1:T,1:N)),
check.names=FALSE)
M[,1:N] <- rnorm(T,mean=0,sd=1)
x <- sapply(1:N,function(i) {
M[,i] = M[,i] * sigma_base / sd(M[,i])
M[,i] = M[,i] + mu_base - mean(M[,i])
})
# tweak one trial to exhibit low overfit
sr_case = 1
mu_case = sr_case/(260.0)
sigma_case = sigma_base
i = N
M[,i] <- rnorm(T,mean=0,sd=1)
M[,i] = M[,i] * sigma_case / sd(M[,i]) # re-scale
M[,i] = M[,i] + mu_case - mean(M[,i]) # re-center
cluster <- makeCluster(detectCores())
registerDoParallel(cluster)
pp_pbo <- pbo(M,S,F=Omega,threshold=1,allow_parallel=TRUE)
stopCluster(cluster)
histogram(pp_pbo)utils for the combinationslattice for plotslatticeExtra over plot overlays only for the SD2
measuregrid for plot labelingforeach for parallel computation of the backtest
foldsBailey, David H. and Borwein, Jonathan M. and Lopez de Prado, Marcos and Zhu, Qiji Jim, The Probability of Back-Test Overfitting (September 1, 2013). Available at SSRN: https://papers.ssrn.com/sol3/papers.cfm?abstract_id=2326253.
These binaries (installable software) and packages are in development.
They may not be fully stable and should be used with caution. We make no claims about them.
Health stats visible at Monitor.