The hardware and bandwidth for this mirror is donated by dogado GmbH, the Webhosting and Full Service-Cloud Provider. Check out our Wordpress Tutorial.
If you wish to report a bug, or if you are interested in having us mirror your free-software or open-source project, please feel free to contact us at mirror[@]dogado.de.

This R package provides helper functions I found useful when developing R code - perhaps you will too! The released package version can be installed via:
install.packages("oeli")The following shows some demos. Click the headings for references on all available helpers in each category.
The package has density and sampling functions for some distributions not included in base R, like the Dirichlet:
ddirichlet(x = c(0.2, 0.3, 0.5), concentration = 1:3)
#> [1] 4.5
rdirichlet(concentration = 1:3)
#> [1] 0.01795087 0.41315984 0.56888929
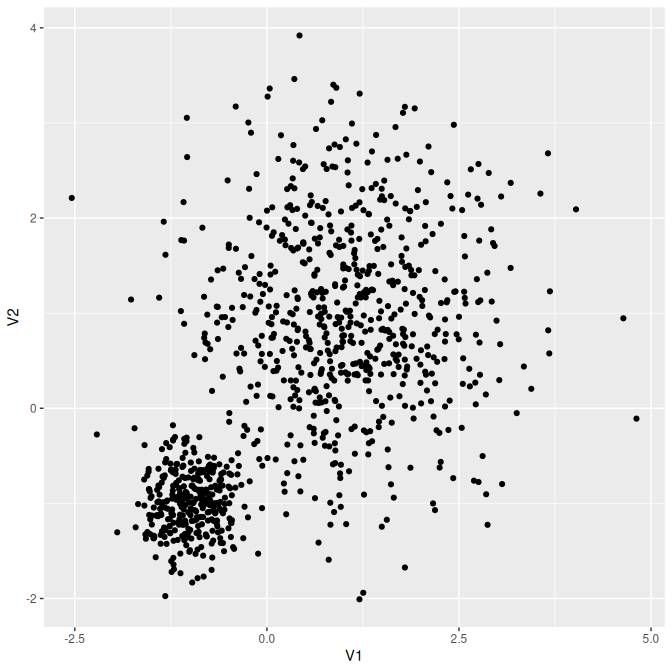
Or the mixture of Gaussian distributions:
x <- c(0, 0)
mean <- matrix(c(1, 1, -1, -1), ncol = 2) # means in columns
Sigma <- matrix(c(diag(2), 0.1 * diag(2)), ncol = 2) # vectorized covariances in columns
proportions <- c(0.7, 0.3)
dmixnorm(x = x, mean = mean, Sigma = Sigma, proportions = proportions)
#> [1] 0.04100656
pmixnorm(x = x, mean = mean, Sigma = Sigma, proportions = proportions)
#> [1] 0.3171506
rmixnorm(n = 1000, mean = mean, Sigma = Sigma, proportions = proportions) |>
  as.data.frame() |>
  ggplot2::ggplot() + ggplot2::geom_point(ggplot2::aes(x = V1, y = V2))
Retrieving default arguments of a function:
f <- function(a, b = 1, c = "", ...) { }
function_defaults(f)
#> $b
#> [1] 1
#>
#> $c
#> [1] ""Create all possible permutations of vector elements:
permutations(LETTERS[1:3])
#> [[1]]
#> [1] "A" "B" "C"
#>
#> [[2]]
#> [1] "A" "C" "B"
#>
#> [[3]]
#> [1] "B" "A" "C"
#>
#> [[4]]
#> [1] "B" "C" "A"
#>
#> [[5]]
#> [1] "C" "A" "B"
#>
#> [[6]]
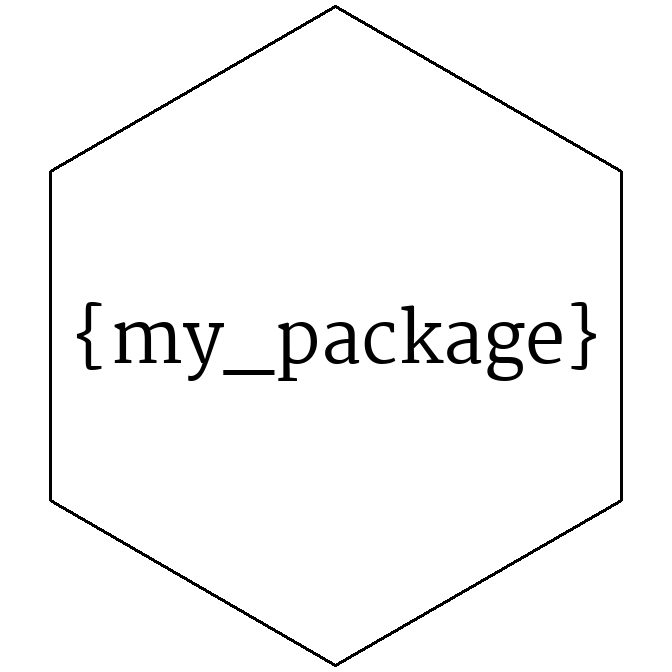
#> [1] "C" "B" "A"Quickly have a basic logo for your new package:
logo <- package_logo("my_package", brackets = TRUE)
print(logo)
How to print a matrix without filling up the entire
console?
x <- matrix(rnorm(10000), ncol = 100, nrow = 100)
print_matrix(x, rowdots = 4, coldots = 4, digits = 2, label = "what a big matrix")
#> what a big matrix : 100 x 100 matrix of doubles
#>         [,1]  [,2] [,3] ... [,100]
#> [1,]    -0.3 -0.74 -0.1 ...   1.01
#> [2,]    1.39 -2.06 1.29 ...   -0.5
#> [3,]   -0.45 -1.57 0.43 ...   1.61
#> ...      ...   ...  ... ...    ...
#> [100,]  1.12  0.77 -1.6 ...  -0.08
And what about a data.frame?
x <- data.frame(x = rnorm(1000), y = LETTERS[1:10])
print_data.frame(x, rows = 7, digits = 0)
#>      x  y
#> 1     0 A
#> 2     1 B
#> 3     0 C
#> 4    -1 D
#> <993 rows hidden>
#>
#> 998   0 H
#> 999   0 I
#> 1000 2 JLet’s simulate correlated regressor values from different marginal distributions:
labels <- c("P", "C", "N1", "N2", "U")
n <- 100
marginals <- list(
  "P" = list(type = "poisson", lambda = 2),
  "C" = list(type = "categorical", p = c(0.3, 0.2, 0.5)),
  "N1" = list(type = "normal", mean = -1, sd = 2),
  "U" = list(type = "uniform", min = -2, max = -1)
)
correlation <- matrix(
  c(1, -0.3, -0.1, 0, 0.5,
    -0.3, 1, 0.3, -0.5, -0.7,
    -0.1, 0.3, 1, -0.3, -0.3,
    0, -0.5, -0.3, 1, 0.1,
    0.5, -0.7, -0.3, 0.1, 1),
  nrow = 5, ncol = 5
)
data <- correlated_regressors(
  labels = labels, n = n, marginals = marginals, correlation = correlation
)
head(data)
#>   P C         N1         N2         U
#> 1 0 3  2.9451097 -0.8638549 -1.921007
#> 2 2 1 -5.1350957  1.3390663 -1.133347
#> 3 3 1 -1.2722775 -0.1166058 -1.174671
#> 4 2 2 -1.5969501  0.3877268 -1.493931
#> 5 3 2 -0.3863015  0.5339768 -1.395497
#> 6 5 1 -3.6924075  0.9798459 -1.066466
cor(data)
#>               P          C          N1           N2           U
#> P   1.000000000 -0.2598683 -0.02141804 -0.008708831  0.44863283
#> C  -0.259868343  1.0000000  0.25880138 -0.523439321 -0.71222969
#> N1 -0.021418038  0.2588014  1.00000000 -0.300000000 -0.24632069
#> N2 -0.008708831 -0.5234393 -0.30000000  1.000000000  0.09679108
#> U 0.448632829 -0.7122297 -0.24632069 0.096791077 1.00000000The group_data.frame() function groups a given
data.frame based on the values in a specified column:
df <- data.frame("label" = c("A", "B"), "number" = 1:10)
group_data.frame(df = df, by = "label")
#> $A
#>   label number
#> 1     A      1
#> 3     A      3
#> 5     A      5
#> 7     A      7
#> 9     A      9
#>
#> $B
#>    label number
#> 2      B      2
#> 4      B      4
#> 6      B      6
#> 8      B      8
#> 10 B 10Is my matrix a proper transition probability matrix?
matrix <- diag(4)
matrix[1, 2] <- 1
check_transition_probability_matrix(matrix)
#> [1] "Must have row sums equal to 1"
These binaries (installable software) and packages are in development.
They may not be fully stable and should be used with caution. We make no claims about them.
Health stats visible at Monitor.