The hardware and bandwidth for this mirror is donated by dogado GmbH, the Webhosting and Full Service-Cloud Provider. Check out our Wordpress Tutorial.
If you wish to report a bug, or if you are interested in having us mirror your free-software or open-source project, please feel free to contact us at mirror[@]dogado.de.
![]()
![]()
![]()
minipdf is a package for creating simple PDF
documents.
create_pdf() to create an empty PDF documentwrite_pdf() to write a PDF to file or stringpdf_line(), pdf_rect(),
pdf_circle(), pdf_polygon(),
pdf_polyline(), pdf_text(),
pdf_bezier(), pdf_image() - functions for
adding graphical elements to the PDFpdf_clip_polygon(), pdf_clip_rect() define
global clipping regionsclip_polygon(), clip_rect() define
per-element clipping regionspdf_rotate(), pdf_translate(),
pdf_scale() define global transformationstf_rotate(), tf_translate(),
tf_scale() define per-element transformationspgpar() define PDF graphical parameterspdf_newpage() begin a new page in the PDFYou can install the development version from GitHub with:
# install.packages("devtools")
devtools::install_github("coolbutuseless/minipdf")doc <- create_pdf(width = 400, height = 250) |>
pdf_circle(80, 100, 50, fill = 'lightblue', col = 'black') |>
pdf_rect(150, 50, 100, 100, fill = 'yellow', col = 'red', lty = 2) |>
pdf_polygon(c(270, 390, 330), c(50, 50, 150)) |>
pdf_text("Hello World!", x = 30, y = 170, fontsize = 50)write_pdf(doc, "man/figures/helloworld.pdf")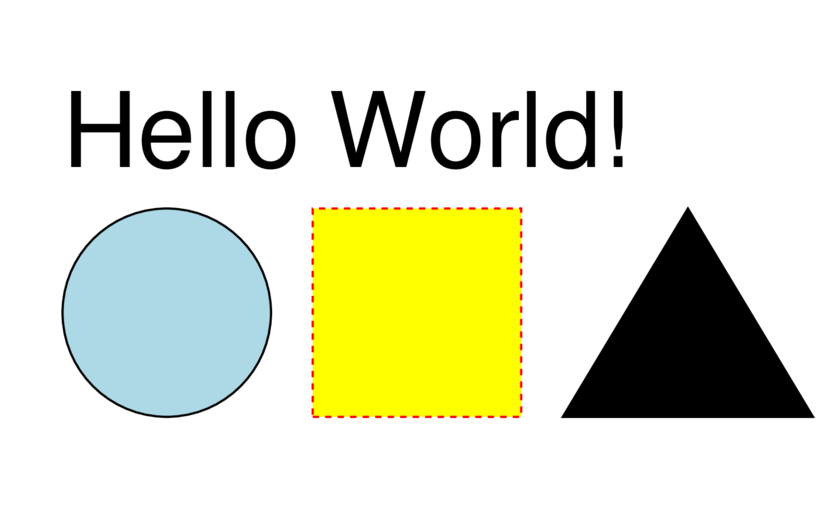
In write_pdf() if the output filename is not specified,
then the function returns the PDF document as a string
write_pdf(doc) |> cat()%PDF-1.7
1 0 obj
<<
/Creator (minipdf/R)
/CreationDate (D:202508230942)
>>
endobj
2 0 obj
<<
/Type /Catalog
/Pages 3 0 R
>>
endobj
3 0 obj
<<
/Type /Pages
/Resources 4 0 R
/MediaBox [0 0 400 250]
/Kids [ 5 0 R ]
/Count 1
>>
endobj
4 0 obj
<<
/ExtGState
<<
/GS1
<<
/CA 1
/ca 1
>>
>>
/Font
<<
/F1
<<
/Type /Font
/Subtype /Type1
/BaseFont /Helvetica
>>
>>
>>
endobj
5 0 obj
<<
/Type /Page
/Parent 3 0 R
/Contents [6 0 R 7 0 R 8 0 R 9 0 R 10 0 R]
>>
endobj
6 0 obj
<<
/Length 37
>>
stream
0 0 400 250 re W n
0 0 400 250 re W n
endstream
endobj
7 0 obj
<<
/Length 284
>>
stream
q
0 0 0 RG
0.67843137254902 0.847058823529412 0.901960784313726 rg
130 100 m
130 127.61423749155 107.61423749155 150 80 150 c
52.38576250845 150 30 127.61423749155 30 100 c
30 72.38576250845 52.38576250845 50 80 50 c
107.61423749155 50 130 72.38576250845 130 100 c
b
Q
endstream
endobj
8 0 obj
<<
/Length 49
>>
stream
q
1 0 0 RG
1 1 0 rg
[3] 0 d
150 50 100 100 re b
Q
endstream
endobj
9 0 obj
<<
/Length 51
>>
stream
q
0 0 0 RG
0 0 0 rg
270 50 m 390 50 l 330 150 l b
Q
endstream
endobj
10 0 obj
<<
/Length 70
>>
stream
q
0 0 0 RG
0 0 0 rg
BT
/F1 50 Tf
30 170 Td
0 Tr
(Hello World!) Tj
ET
Q
endstream
endobj
xref
0 11
0000000000 65535 f
0000000009 00000 n
0000000086 00000 n
0000000139 00000 n
0000000249 00000 n
0000000447 00000 n
0000000543 00000 n
0000000632 00000 n
0000000969 00000 n
0000001070 00000 n
0000001173 00000 n
trailer
<<
/Size 11
/Info 1 0 R
/Root 2 0 R
>>
startxref
1296
%%EOFMost coordinate arguments can be vectors - this means multiple objects can be generated with a single call.
Note that all objects created in this way share a single graphics state i.e. they’ll all be the same color etc.
im  <- png::readPNG(system.file("img", "Rlogo.png", package="png")) * 255


doc <- create_pdf(width = 400, height = 200) |>
  pdf_circle(
    x = seq(0, 400, length.out = 9),
    y = 100,
    r = 2 * (1:9),
    col = 'black', lwd = 1, fill = 'lightblue'
  ) |>
  pdf_line(
    x1 = seq(0, 400, length.out = 9),
    y1 = 100,
    x2 = seq(400, 0, length.out = 9),
    y2 = 200,
    lty = 3, col = 'blue'
  ) |>
  pdf_text(
    "#RStats",
    x = 0,
    y = seq(0, 200, length.out = 10),
    fill       = 'grey80',
    fontfamily = 'mono',
    fontsize   = seq(12, 30, length.out = 10)
  ) |>
pdf_image(im = im, x = 300, y = 10, scale = 0.75)write_pdf(doc, "man/figures/simple.pdf")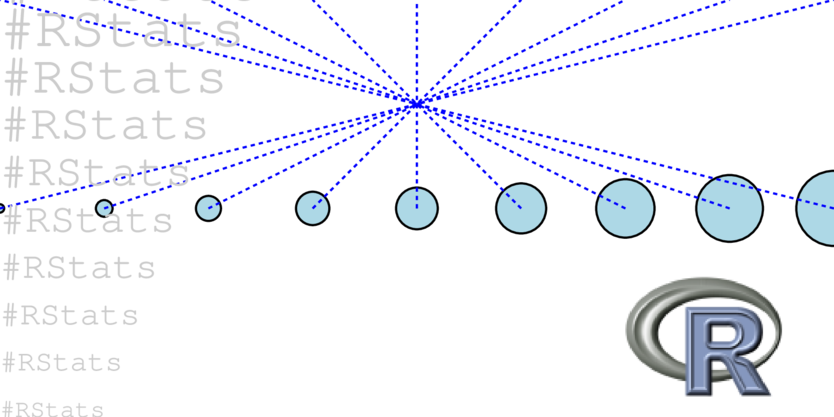
doc <- create_pdf(height = 400, width = 600)

N <- 400
xs <- sample(600, N, TRUE)
ys <- sample(400, N, TRUE)
rs <- sample(100, N, TRUE)
cs <- sample(colors(), N, TRUE)

for (i in seq_len(N)) {
  doc <- pdf_circle(doc, xs[i], ys[i], rs[i], col = NA, fill = cs[i], alpha = 0.2)
}

doc <- pdf_translate(doc, 50, 0)

doc <- pdf_text(doc, "#RStats", 10, 150, fontsize = 120, mode = 1, col = 'black',
fontface = 'bold.italic', lwd = 5)write_pdf(doc, "man/figures/example1.pdf")
N <- 100

doc <- create_pdf() |>
  pdf_bezier(
    x0 = seq(0, 400, length.out = N),
    y0 = 10,
    x1 = 25,
    y1 = seq(20, 300, length.out = N),
    x2 = seq(100, 80, length.out = N),
    y2 = 250,
    x3 = 400,
    y3 = seq(400, 300, length.out = N),
    alpha = 0.2
)write_pdf(doc, "man/figures/beziers.pdf")
These binaries (installable software) and packages are in development.
They may not be fully stable and should be used with caution. We make no claims about them.
Health stats visible at Monitor.