

The hardware and bandwidth for this mirror is donated by dogado GmbH, the Webhosting and Full Service-Cloud Provider. Check out our Wordpress Tutorial.
If you wish to report a bug, or if you are interested in having us mirror your free-software or open-source project, please feel free to contact us at mirror[@]dogado.de.
A beautiful tile grid map is only a function call away! Tile grid maps are a great way to display geographic data when you want to represent regions with equal visual space. No shapefiles required, just supply a vector of postal abbreviations and a corresponding vector of colors. Built with base graphics.
If you’re unfamilar with tile grid maps, check out the examples below or see the following news articles:
library(devtools)
install_github("seankross/minimap")# La Patria Es Primero
library(minimap)
minimexico(mexico_abb, colorRampPalette(c("#006847", "white", "#CE1126"))(32),
estados_name_colors = rep("black", 32))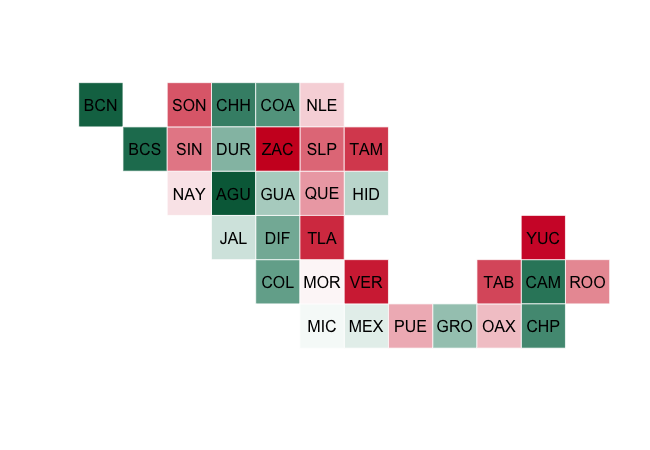
# Legal Status of Same Sex Marriage in the United States (2008)

library(minimap)

determine_color <- function(status){
  if(status == "bbs")
    "#FFE597"
  else if(status == "nl")
    "#F1F1F0"
  else if (status == "dis")
    "#D0C7B9"
  else if(status == "bbca")
    "#FDC471"
  else
    "#817972"
}

ssm$color <- as.character(sapply(ssm$Status, determine_color))
ssm_2008 <- ssm[ssm$Year == 2008,]
miniusa(ssm_2008$State, state_colors = ssm_2008$color, state_names = TRUE,
        state_name_colors = rep("white", 51))
title(main = "Legal Status of Same Sex Marriage in 2008", line = -1)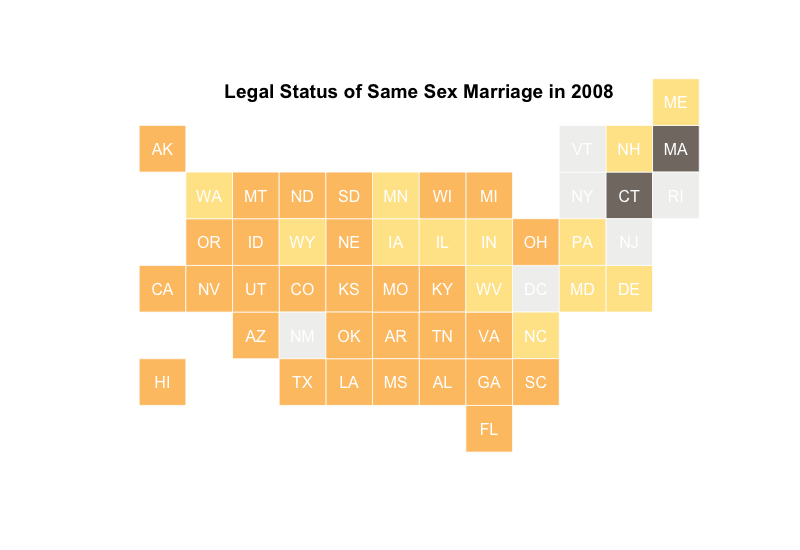
# Legal Status of Gay Marriage Over Time

library(minimap)

old_mai <- par()$mai
par(mai = c(0, 0, .75, .5), mfrow = c(2, 4))

for(i in 2008:2015){
  one_year <- ssm[ssm$Year == i,]
  miniusa(one_year$State, state_colors = one_year$color, state_names = FALSE)
  title(main = i, line = -2)
}

mtext("Legal Status of Gay Marriage Over Time", outer = TRUE, side = 3, line = -2)

par(mai = old_mai, mfrow = c(1, 1))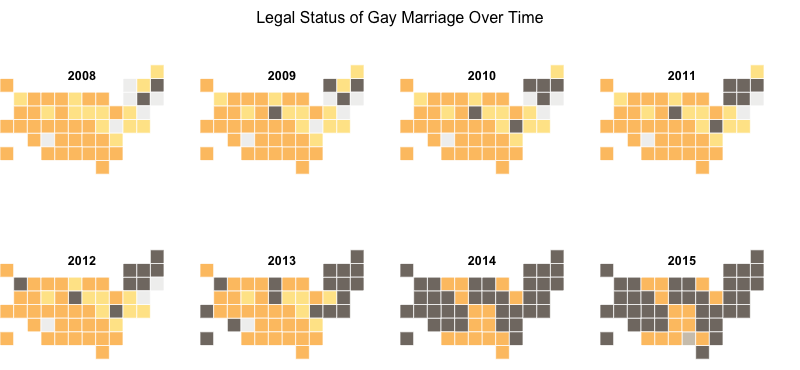
# Forty Years of Canadian Milk Production

library(minimap)
library(dplyr)
library(RColorBrewer)
library(animation)

bin <- function(x){
  qs <- as.numeric(quantile(x, seq(0, 1, .1)))
  sapply(x, function(y){
    which(abs(qs-y)==min(abs(qs-y)))
  })
}

milk_year <- milk %>%
  group_by(Region, Year) %>%
  summarise(Total_kL = sum(Kiloliters))

max_milk <- milk_year %>%
  group_by(Region) %>%
  summarise(Max = max(Total_kL))

milk_year <- milk_year %>%
  left_join(max_milk) %>%
  group_by(Region) %>%
  mutate(Bin = bin(Total_kL)) %>%
  select(Region, Year, Bin)

missing_pt <- setdiff(canada_abb, unique(milk_year$Region))

missing_milk <- data.frame(Region = rep(missing_pt, each = 40),
                           Year = rep(1976:2015, 3),
                           Bin = rep(0, 120), stringsAsFactors = FALSE)
milk_year <- rbind(milk_year, missing_milk)

milk_year$color <- sapply(milk_year$Bin, function(x){
  if(x == 0){
    "grey80"
  } else {
    brewer.pal(11, "PuOr")[x]
  }
})

ani.options(interval = 0.4, ani.width = 600, ani.height = 450)

saveGIF(
  for(i in 1976:2015){
    milkgif <- milk_year[milk_year$Year == i,]
    minicanada(milkgif$Region, pt_colors = milkgif$color, pt_name_cex = 1.5)
    title(main = paste("Canadian Milk Production in", i), line = -1)
  }
)
# Legal Status of Gay Marriage Over Time (gif)

library(minimap)
library(animation)

determine_color <- function(status){
  if(status == "bbs")
    "#FFE597"
  else if(status == "nl")
    "#F1F1F0"
  else if (status == "dis")
    "#D0C7B9"
  else if(status == "bbca")
    "#FDC471"
  else
    "#817972"
}

ssm$color <- as.character(sapply(ssm$Status, determine_color))

ani.options(interval = 0.5, ani.width = 600, ani.height = 450)

saveGIF(
  for(i in 1992:2015){
    one_year <- ssm[ssm$Year == i,]
    miniusa(one_year$State, state_colors = one_year$color)
    title(main = paste("Legal Status of Same Sex Marriage in", i), line = -1)
  }
)
These binaries (installable software) and packages are in development.
They may not be fully stable and should be used with caution. We make no claims about them.
Health stats visible at Monitor.