
The hardware and bandwidth for this mirror is donated by dogado GmbH, the Webhosting and Full Service-Cloud Provider. Check out our Wordpress Tutorial.
If you wish to report a bug, or if you are interested in having us mirror your free-software or open-source project, please feel free to contact us at mirror[@]dogado.de.
![]()
The goal of methcon5 is to identify and rank CpG DNA methylation conservation along the human genome. Specifically, it includes bootstrapping methods to provide ranking which should adjust for the differences in length as without it short regions tend to get higher conservation scores.
The following repository includes an analysis in which this package was used.
Please note that the name of the package is in all lowercase.
You can install the released version of methcon5 from CRAN with:
install.packages("methcon5")And the development version from GitHub with:
# install.packages("devtools")
devtools::install_github("EmilHvitfeldt/methcon5")First we apply the meth_aggregate function. This will
take the columns specified in value and apply the
fun stratified according to id. In this case,
we want to calculate the mean meth value within each gene.
library(methcon5)
sample_ii <- fake_methylation %>%
  meth_aggregate(id = gene, value = meth, fun = mean)

sample_ii
#> # A tibble: 500 x 3
#>     gene  meth     n
#>  * <int> <dbl> <int>
#>  1     1 0.509    10
#>  2     2 0.817     6
#>  3     3 0.577     5
#>  4     4 0.279     9
#>  5     5 0.318     5
#>  6     6 0.427     6
#>  7     7 0.736     4
#>  8     8 0.546     2
#>  9     9 0.328     7
#> 10    10 0.202     6
#> # … with 490 more rows
Next we use the meth_bootstrap function. This will take
the summarized data.frame calculated earlier along with the original
dataset. The function with return the original data.frame with the new
column attached to the end, which makes it ideal for piping to apply
different methods to the same data.
adjusted <- sample_ii %>%
  meth_bootstrap(reps = 100) %>%
  meth_bootstrap(reps = 100, method = "perm_v2") %>%
  meth_bootstrap(reps = 100, method = "perm_v3")
adjusted
#> # A tibble: 500 x 6
#>     gene  meth     n meth_perm_v1 meth_perm_v2 meth_perm_v3
#>  * <int> <dbl> <int>        <dbl>        <dbl>        <dbl>
#>  1     1 0.509    10         0.52         0.6          0.39
#>  2     2 0.817     6         0            0.01         0
#>  3     3 0.577     5         0.28         0.33         0.42
#>  4     4 0.279     9         1            0.91         0.9
#>  5     5 0.318     5         0.96         0.81         0.76
#>  6     6 0.427     6         0.78         0.69         0.63
#>  7     7 0.736     4         0.05         0.16         0.15
#>  8     8 0.546     2         0.38         0.42         0.54
#>  9     9 0.328     7         1            0.79         0.81
#> 10    10 0.202     6         1            1            0.95
#> # … with 490 more rowslibrary(ggplot2)
ggplot(adjusted, aes(meth_perm_v1, meth_perm_v2, color = n)) +
geom_point() +
scale_color_viridis_c() +
theme_minimal()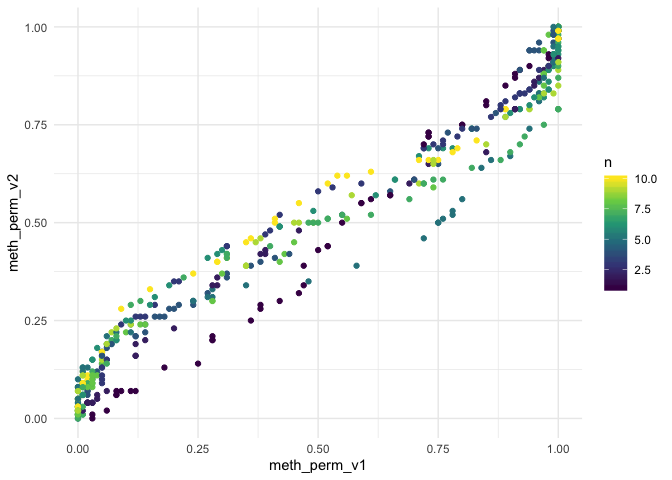
We gratefully acknowledge funding from NIH awards 1P01CA196569 and R21 CA226106.
These binaries (installable software) and packages are in development.
They may not be fully stable and should be used with caution. We make no claims about them.
Health stats visible at Monitor.