


The hardware and bandwidth for this mirror is donated by dogado GmbH, the Webhosting and Full Service-Cloud Provider. Check out our Wordpress Tutorial.
If you wish to report a bug, or if you are interested in having us mirror your free-software or open-source project, please feel free to contact us at mirror[@]dogado.de.
mcstatsim
mcstatsim is a lightweight, functional-style toolkit for
Monte Carlo simulation studies. Its core is a higher-order
driver, runsim(): you write the simulation as a
function of its parameters, and runsim() maps it over a
grid of conditions, owning the iteration, parallelism, reproducible
random-number streams, error capture and result assembly. Around it the
package ships ready-to-use performance measures, an
evaluation layer that turns raw replicates into a tidy
results table, and diagnostic plots.
The only hard dependency is functionals.
ggplot2 is used by the plotting helpers and is
optional.
runsim() takes a grid of conditions (one row per
scenario), a simulation function whose arguments match the grid columns,
and the number of replications. It builds one flat list of
n * nrow(grid) jobs, runs them in a single load-balanced
parallel pass, and row-binds the results into a data frame with the grid
columns, the quantities returned by the simulation function, and a
replication index ID.
install.packages("mcstatsim")                    # released version
# install.packages("remotes")
remotes::install_github("ielbadisy/mcstatsim") # development versionWe evaluate the normal-theory 95% confidence interval for a mean when
the data are drawn either from a normal distribution or from a skewed
(centred log-normal) distribution, across three sample sizes. The true
mean is 0 in every cell, so we expect bias near zero and
coverage near 0.95, but the t-interval is known to
under-cover under skew at small n.
library(mcstatsim)

sim_mean_ci <- function(n, dist) {
  x <- if (dist == "normal") rnorm(n) else rlnorm(n) - exp(0.5)  # both have mean 0
  est <- mean(x)
  se  <- sd(x) / sqrt(n)
  crit <- qt(0.975, df = n - 1)
  data.frame(
    est      = est,
    lo       = est - crit * se,
    hi       = est + crit * se,
    true_val = 0
  )
}

grid <- expand.grid(n = c(10, 30, 100), dist = c("normal", "lognormal"),
                    stringsAsFactors = FALSE)
grid
#>     n      dist
#> 1  10    normal
#> 2  30    normal
#> 3 100    normal
#> 4  10 lognormal
#> 5  30 lognormal
#> 6 100 lognormalseed gives every job its own independent
L'Ecuyer-CMRG stream, so the run is reproducible and does
not depend on the number of cores.
res <- runsim(
  n           = 2000,
  grid_params = grid,
  sim_func    = sim_mean_ci,
  seed        = 2025,
  num_cores   = 2,
  show_progress = FALSE
)

head(res)
#>     n      dist          est          lo         hi true_val ID
#> 1  10    normal  0.433489939 -0.35003582 1.21701569        0  1
#> 2  30    normal -0.363420104 -0.74905905 0.02221884        0  1
#> 3 100    normal  0.162087539 -0.03781371 0.36198879        0  1
#> 4  10 lognormal  0.292061905 -1.37614955 1.96027336        0  1
#> 5  30 lognormal -0.147570162 -0.56076715 0.26562683        0  1
#> 6 100 lognormal  0.004260512 -0.37423359 0.38275461        0  1
nrow(res)
#> [1] 12000perf <- summarise_sim(
res,
by = c("n", "dist"),
measures = list(
bias = ~ calc_bias(est, true_val[1]),
coverage = ~ calc_coverage(lo, hi, true_val[1]),
width = ~ calc_width(lo, hi)
)
)
perf
#> n dist n_sim bias bias_mcse coverage coverage_mcse width
#> 1 10 lognormal 2000 -0.0113 0.0153 0.8370 0.0083 2.4341
#> 2 10 normal 2000 0.0092 0.0068 0.9515 0.0048 1.3913
#> 3 30 lognormal 2000 -0.0009 0.0090 0.8750 0.0074 1.4440
#> 4 30 normal 2000 0.0016 0.0042 0.9455 0.0051 0.7402
#> 5 100 lognormal 2000 -0.0007 0.0048 0.9190 0.0061 0.8079
#> 6 100 normal 2000 -0.0004 0.0023 0.9470 0.0050 0.3957
#> width_mcse
#> 1 0.0396
#> 2 0.0075
#> 3 0.0181
#> 4 0.0022
#> 5 0.0062
#> 6 0.0006Each calc_* measure contributes its estimate and its
Monte Carlo standard error (the *_mcse columns). Numeric
columns are rounded to digits (default 4); pass
digits = NULL to summarise_sim() for full
precision.
Check that no replicate produced a non-finite estimate:
check_estimates(res, by = c("n", "dist"))
#> [1] n        dist     column   n_bad    n_total  prop_bad
#> <0 rows> (or 0-length row.names)
How many replications would we need to pin the coverage MCSE down to 0.0025?
data.frame(perf[c("n", "dist")],
           coverage_mcse = round(perf$coverage_mcse, 4),
           reps_for_0.0025 = mcse_target(perf$coverage_mcse, perf$n_sim, target = 0.0025))
#>     n      dist coverage_mcse reps_for_0.0025
#> 1  10 lognormal        0.0083           22045
#> 2  10    normal        0.0048            7373
#> 3  30 lognormal        0.0074           17524
#> 4  30    normal        0.0051            8324
#> 5 100 lognormal        0.0061           11908
#> 6 100 normal 0.0050 8000Convergence trace. The running mean of the point estimate with a Monte Carlo standard-error band, one panel per condition:
plot_convergence(res, "est", by = c("n", "dist"))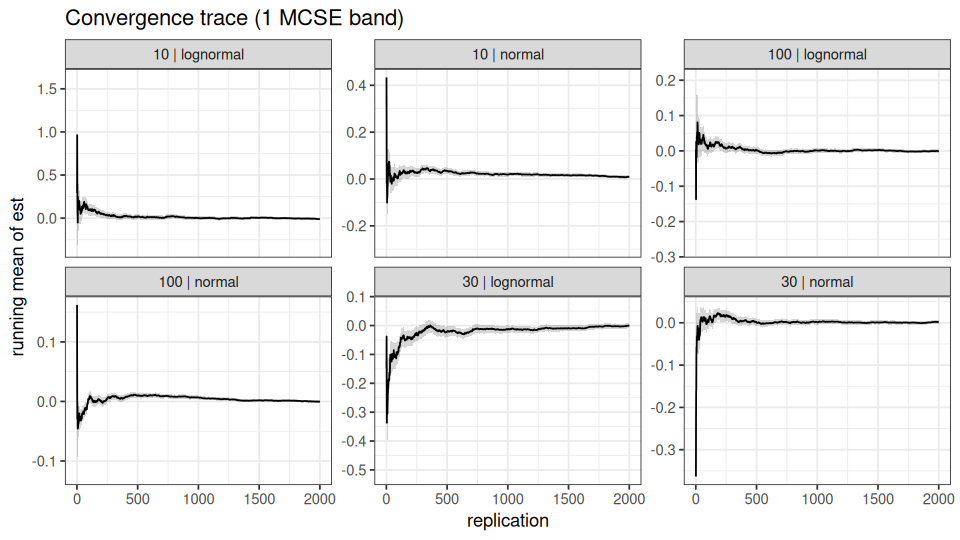
Zip plot (Morris, White and Crowther, 2019).
Confidence intervals sorted by the extremeness of their z-statistic and
coloured by whether they cover; a well-calibrated interval fills the
panel up to the nominal line in the “covers” colour. Shown here for
n = 10:
plot_zip(res[res$n == 10, ], "lo", "hi", "true_val", by = "dist")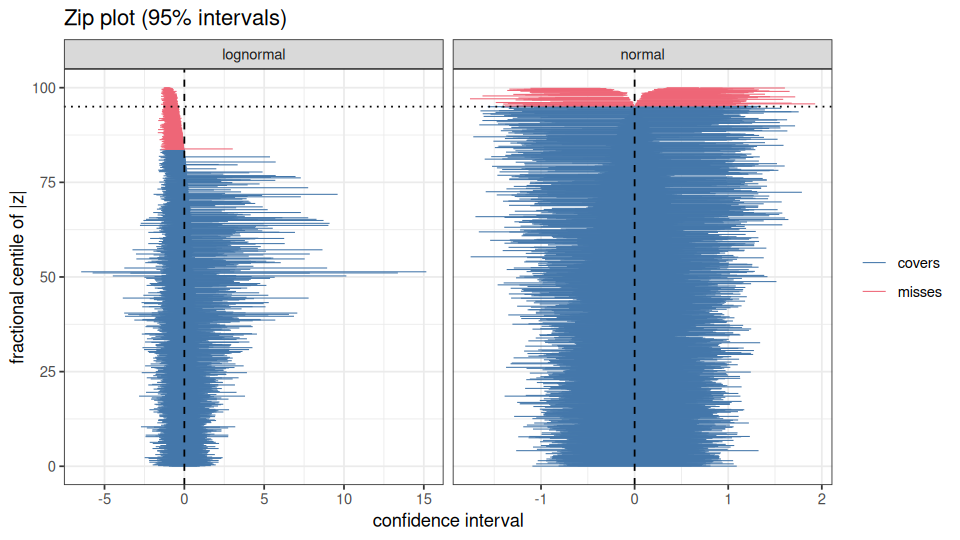
Performance across the design. Coverage with a
+/- 2 MCSE bar against the nominal 0.95 line:
plot_performance(perf, "coverage", x = "n", colour = "dist", ref = 0.95)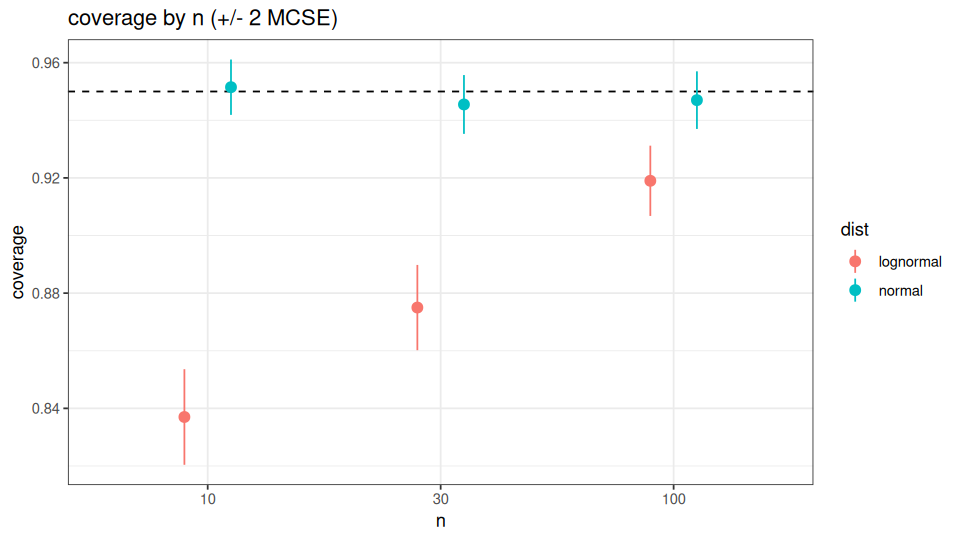
The log-normal intervals under-cover at n = 10 (the zip
plot shows the misses concentrated on one side, the signature of skew)
and climb back toward 0.95 as n grows. The normal-data
intervals sit on 0.95 throughout.
a <- runsim(200, grid, sim_mean_ci, seed = 1, num_cores = 1, show_progress = FALSE)
b <- runsim(200, grid, sim_mean_ci, seed = 1, num_cores = 4, show_progress = FALSE)
identical(a$est, b$est)
#> [1] TRUE
If a simulation function errors on some cells,
on_error = "warn" (or "omit") drops those jobs
and records them in attr(x, "errors"), which
failure_summary() aggregates per condition. Warnings raised
inside the simulation function are kept in
attr(x, "warnings").
fragile <- function(n, dist) {
  if (dist == "lognormal" && n == 10 && runif(1) < 0.1) stop("fit did not converge")
  sim_mean_ci(n, dist)
}
r <- runsim(200, grid, fragile, seed = 1, on_error = "omit",
            num_cores = 1, show_progress = FALSE)
nrow(r)
#> [1] 1179
failure_summary(r)
#>    n      dist n_failed failure_rate        example_error
#> 1 10 lognormal       21        0.105 fit did not converge
A save_path makes a long run resumable: the result is
checkpointed after each chunk of checkpoint_every
replications, and re-running runsim() with the same
save_path, n, grid_params and
seed loads the completed replications and runs only the
rest. A resumed run reproduces an uninterrupted one exactly.
ckpt <- tempfile(fileext = ".rds")
r1 <- runsim(200, grid, sim_mean_ci, seed = 1, save_path = ckpt,
             checkpoint_every = 50, num_cores = 1, show_progress = FALSE)
identical(r1$est, a$est)
#> [1] TRUEcalc_bias(), calc_variance(),
calc_mse(), calc_rmse(),
calc_coverage(), calc_width(),
calc_rejection_rate(), calc_relative_bias(),
calc_relative_mse(), calc_relative_rmse().
Each returns the estimate together with its Monte Carlo standard error,
rounded to digits (default 4; NULL for full
precision). They can be used on their own or inside
summarise_sim().
est <- res$est[res$n == 30 & res$dist == "normal"]
calc_bias(est, 0)
#> $bias
#> [1] 0.0016
#>
#> $bias_mcse
#> [1] 0.0042
calc_rmse(est, 0, digits = NULL)
#> $rmse
#> [1] 0.1860117
#>
#> $rmse_mcse
#> [1] 0.003563415mcpmap() maps a function over equal-length named lists
in parallel (via functionals), and
combine_df() row-binds a list of lists of data frames,
adding a source ID. runsim() covers most use
cases; these are there for custom drivers.
mcpmap(list(a = 1:3, b = 4:6), function(a, b) a + b, num_cores = 1,
       show_progress = FALSE)
#> [[1]]
#> [1] 5
#>
#> [[2]]
#> [1] 7
#>
#> [[3]]
#> [1] 9runsim() maps it over the
design.summarise_sim() plus
a full set of MCSE-aware measures.The package vignette, “Monte Carlo simulation studies with mcstatsim”
(PDF), walks through runsim(), reproducible RNG, error
handling, checkpoint/resume, summarise_sim(), the
calc_* measures, diagnostics and plots, with a worked case
study:
vignette("mcstatsim", package = "mcstatsim")To cite mcstatsim in publications, use:
citation("mcstatsim")
#> To cite mcstatsim in publications, use:
#>
#>   El Badisy I (2026). _mcstatsim: Monte Carlo Statistical Simulation
#>   Tools Using a Functional Approach_. R package version 0.9.2,
#>   <https://CRAN.R-project.org/package=mcstatsim>.
#>
#> A BibTeX entry for LaTeX users is
#>
#>   @Manual{,
#>     title = {mcstatsim: Monte Carlo Statistical Simulation Tools Using a Functional Approach},
#>     author = {Imad {El Badisy}},
#>     year = {2026},
#>     note = {R package version 0.9.2},
#>     url = {https://CRAN.R-project.org/package=mcstatsim},
#> }Contributions are welcome. Please feel free to open an issue or submit a pull request.
These binaries (installable software) and packages are in development.
They may not be fully stable and should be used with caution. We make no claims about them.
Health stats visible at Monitor.