The hardware and bandwidth for this mirror is donated by dogado GmbH, the Webhosting and Full Service-Cloud Provider. Check out our Wordpress Tutorial.
If you wish to report a bug, or if you are interested in having us mirror your free-software or open-source project, please feel free to contact us at mirror[@]dogado.de.
mbg is an R package for model-based
geostatistics.
The mbg package provides a simple interface to run
spatial machine learning models and geostatistical models that estimate
a continuous (raster) surface from point-referenced observations and,
optionally, a set of raster covariates. The package also includes
functions to summarize raster estimates by (polygon) region while
preserving uncertainty.

The mbg package combines features from the sf, terra, and data.table
packages for spatial data processing; caret for
spatial ML models; and R-INLA for
geostatistical models.
You can install the latest stable version of the mbg package from CRAN:
install.packages("mbg")
Some core package functions rely on R-INLA, which is not available on
CRAN. If you do not already have the INLA package
installed, you can download it following these
instructions.
After installing and package and loading it using
library(mbg), you can access the package vignette by
running help(mbg), or get documentation for a specific
function by running e.g. help(MbgModelRunner).
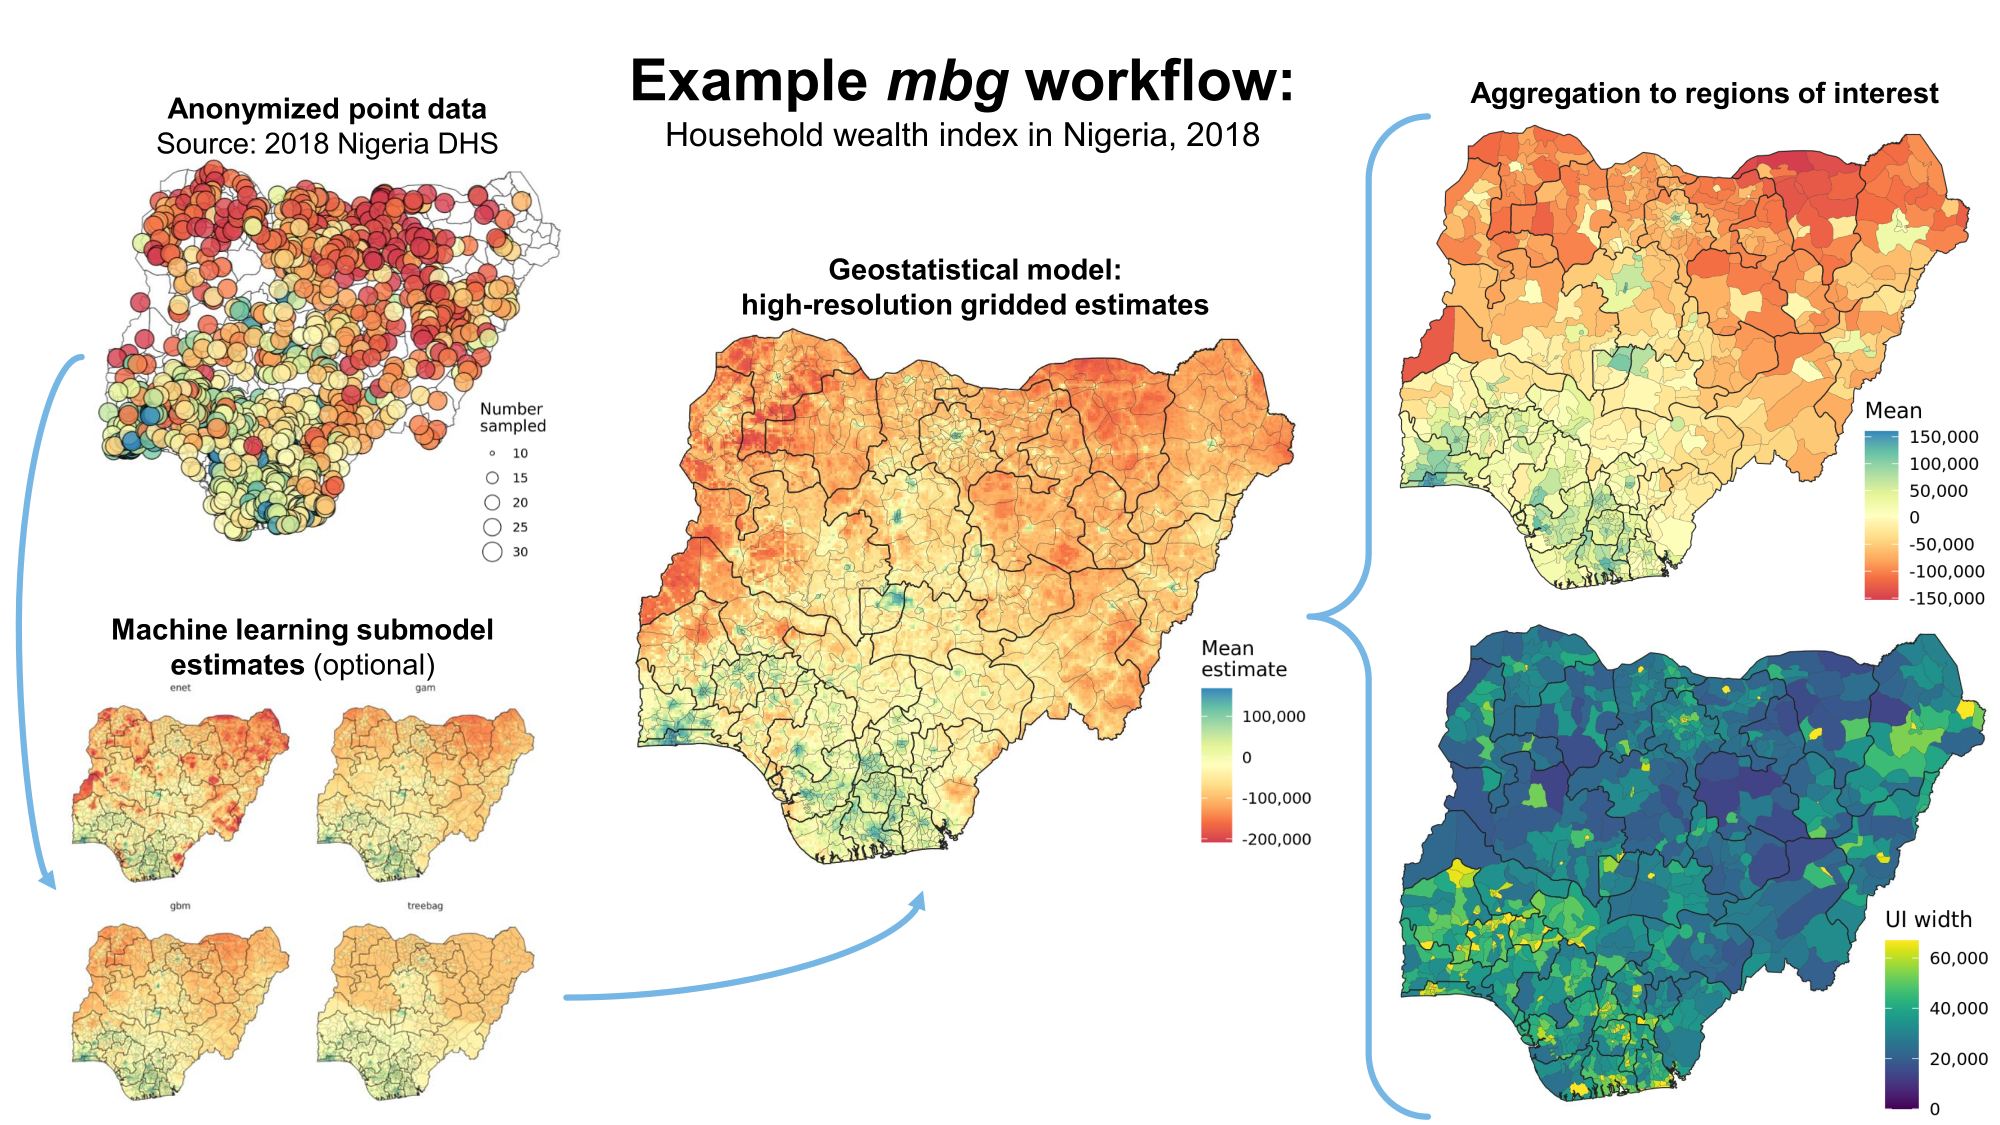
A typical MBG workflow includes the following steps:
For more details, see the introductory vignette.
These binaries (installable software) and packages are in development.
They may not be fully stable and should be used with caution. We make no claims about them.
Health stats visible at Monitor.