The hardware and bandwidth for this mirror is donated by dogado GmbH, the Webhosting and Full Service-Cloud Provider. Check out our Wordpress Tutorial.
If you wish to report a bug, or if you are interested in having us mirror your free-software or open-source project, please feel free to contact us at mirror[@]dogado.de.

The markerpen R package uses penalized principal
component analysis to detect cell-type-specific marker genes from bulk
tissue RNA sequencing data. It is a semi-supervised algorithm that uses
bulk transcriptome data to refine a prior marker gene list, based on the
paper Identification of
cell-type-specific marker genes from co-expression patterns in tissue
samples by Yixuan Qiu, Jiebiao Wang, Jing Lei, and Kathryn
Roeder.
markerpen can be installed directly from CRAN:
install.packages("markerpen")A C++ compiler that supports the C++11 standard is needed to install
markerpen from source.
For best performance, it is strongly suggested linking your R to the OpenBLAS library for matrix computation, although this step is optional. You can achieve this with the help of the ropenblas package.
In this section we show a real example of selecting marker genes from bulk tissue RNA sequencing data.
First, download the gene expression data set and load it into R:
library(markerpen)
library(dplyr)
library(scales)

# Download data
# A subset of the ROSMAP data
dat_url = "https://github.com/ellispatrick/CortexCellDeconv/blob/master/CellTypeDeconvAnalysis/Data/geneExprRaw.txt?raw=true"
download.file(dat_url, destfile = "geneExprRaw.txt", method = "libcurl")

# Read in data - rows are genes, columns are observations
dat = read.table("geneExprRaw.txt", header = TRUE)
# Normalize read count
dat_norm = sweep(dat, 2, colSums(dat), "/")
# Convert gene name to Ensembl name
matched = tibble(name = rownames(dat_norm)) %>%
    inner_join(markerpen::gene_mapping, by = "name")
# Get expression matrix - rows are observations, columns are genes
mat_exp = t(dat_norm[matched$name, ])
colnames(mat_exp) = matched$ensembl
print(mat_exp[1:5, 1:5])
ENSG00000121410 ENSG00000175899 ENSG00000166535 ENSG00000128274 ENSG00000094914
X57978756 7.944190e-06 4.208850e-05 2.541467e-06 1.375366e-05 3.173188e-05
X10518782 6.242954e-06 4.313521e-05 3.572706e-06 6.242954e-06 5.482147e-05
X50302004 1.178625e-05 9.508784e-05 2.600036e-06 9.699912e-06 6.176663e-05
X67429065 8.266322e-06 9.014051e-05 3.295705e-06 1.053372e-05 5.489613e-05
X20214850 9.708929e-06 9.450005e-05 1.316315e-05 2.276931e-05 4.761400e-05Next, read in the prior marker gene lists, collected from the published literature. We also restrict the search range for each cell type to a subset of the whole genome.
The two R data files are provided in the examples
folder.
# Read in prior marker genes
load(system.file("examples", "published_markers.RData", package = "markerpen"))
load(system.file("examples", "markers_range.RData", package = "markerpen"))
Below is the main part of the analysis: selecting marker genes for major cell types. After obtaining the marker genes for one cell type, we remove those genes from the search range for the next cell type, in order to make markers for different cell types non-overlapping. Theoretically the order of the cell types in computing has an impact on the final result, but in practice the impact is small if the cell types can be well separated.
# Markers for astrocytes
ast_re = refine_markers(mat_exp, markers_range$astrocytes, pub_markers$astrocytes,
                        lambda = 0.4, w = 1.5, maxit = 500, verbose = 0)
# Remove selected markers from the expression matrix
mat_rest = mat_exp[, setdiff(colnames(mat_exp), ast_re$markers)]

# Markers for oligodendrocytes
oli_re = refine_markers(mat_rest, markers_range$oligodendrocytes, pub_markers$oligodendrocytes,
                        lambda = 0.4, w = 1.5, maxit = 500, verbose = 0)
mat_rest = mat_rest[, setdiff(colnames(mat_rest), oli_re$markers)]

# Markers for microglia
mic_re = refine_markers(mat_rest, markers_range$microglia, pub_markers$microglia,
                        lambda = 0.4, w = 1.5, maxit = 500, verbose = 0)
mat_rest = mat_rest[, setdiff(colnames(mat_rest), mic_re$markers)]

# Markers for endothelial
end_re = refine_markers(mat_rest, markers_range$endothelial, pub_markers$endothelial,
                        lambda = 0.4, w = 1.5, maxit = 500, verbose = 0)
mat_rest = mat_rest[, setdiff(colnames(mat_rest), end_re$markers)]

# Markers for neurons
neu_re = refine_markers(mat_rest, markers_range$neurons, pub_markers$neurons,
                        lambda = 0.4, w = 1.5, maxit = 500, verbose = 0)

# Refined markers
markers_re = list(astrocytes       = ast_re$markers,
                  oligodendrocytes = oli_re$markers,
                  microglia        = mic_re$markers,
                  endothelial      = end_re$markers,
                  neurons          = neu_re$markers)
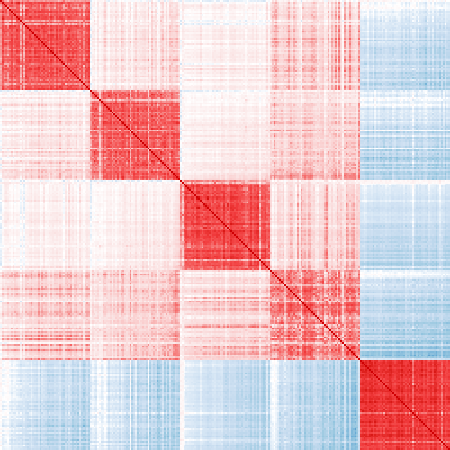
We post-process the selected genes by ordering them and selecting the top 50 markers for each cell type.
# Post-process selected markers
# Pick the first 50 ordered markers
cor_markers = cor(mat_exp[, unlist(markers_re)])
markers_ord = sort_markers(cor_markers, markers_re)
markers_ord = lapply(markers_ord, head, n = 50)
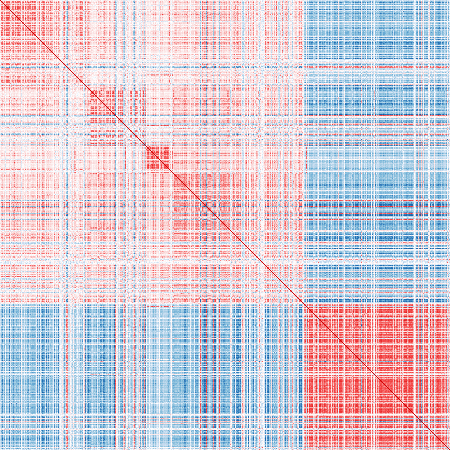
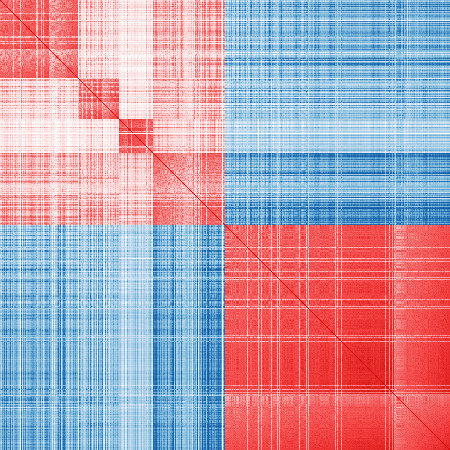
Finally, visualize the sample correlation matrices on published markers and refined markers.
# Function to visualize the sample correlation matrix
vis_cor = function(mat_exp, markers)
{
    all_genes = colnames(mat_exp)
    markers = intersect(unlist(markers), all_genes)
    cor_markers = cor(mat_exp[, unlist(markers)])
    p = nrow(cor_markers)

    cols = c("#08306b", "#08519c", "#2171b5", "#6baed6", "#9ecae1", "#c6dbef", "#deebf7",
             "#ffffff",
             "#fcf1f1", "#fae1e1", "#facdcd", "#f49c9c", "#f56566", "#f13a3c", "#d00003")

    ncols = length(cols)
    cols = scales::gradient_n_pal(cols, values = (0:ncols) / ncols)((1:100) / 100)
    op = par(mar = c(0, 0, 0, 0))
    image(cor_markers[, p:1], col = cols, breaks = (-50:50) / 50, asp = 1, axes = FALSE)
    par(op)
}
Published markers:
vis_cor(mat_exp, pub_markers)
Refined markers:
vis_cor(mat_exp, markers_re)
Ordered top 50 markers for each cell type:
vis_cor(mat_exp, markers_ord)
Please consider to cite our work if you have used our algorithm or package in your research.
@article{qiu2021identification,
  title={Identification of cell-type-specific marker genes from co-expression patterns in tissue samples},
  author={Qiu, Yixuan and Wang, Jiebiao and Lei, Jing and Roeder, Kathryn},
  journal={Bioinformatics},
  volume={37},
  number={19},
  pages={3228--3234},
  year={2021},
  publisher={Oxford University Press}
}
These binaries (installable software) and packages are in development.
They may not be fully stable and should be used with caution. We make no claims about them.
Health stats visible at Monitor.