The hardware and bandwidth for this mirror is donated by dogado GmbH, the Webhosting and Full Service-Cloud Provider. Check out our Wordpress Tutorial.
If you wish to report a bug, or if you are interested in having us mirror your free-software or open-source project, please feel free to contact us at mirror[@]dogado.de.
The goal of mapindia is to simplify mapping of the Indian subcontinent. It has convenient functions for plotting choropleths, visualizing spatial data, and handling state/district codes.
Note: The 3-digit district codes were merged with the 2-digit state codes to create a 5-digit district code.
To install mapindia from CRAN:
install.packages("mapindia")You can install the development version of mapindia from GitHub with:
# install.packages("pak")
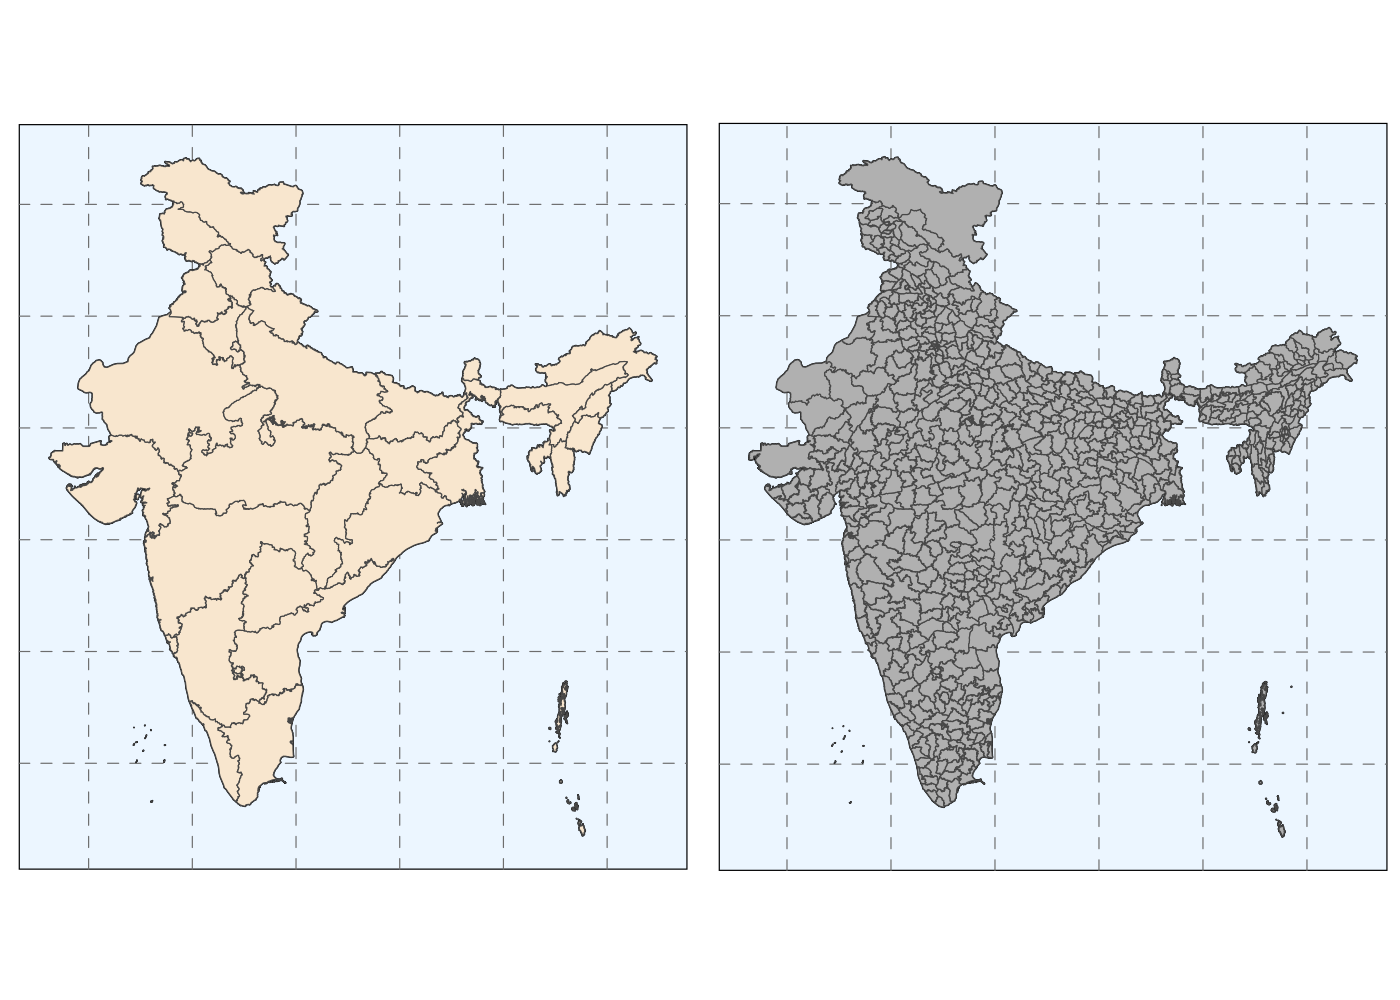
pak::pak("shubhamdutta26/mapindia")library(mapindia)Plot basic maps of the Indian subcontinent with states and districts:
library(mapindia)
library(ggplot2)
library(cowplot)

states <- plot_india("states") +
  geom_sf(fill= "antiquewhite") +
  theme(panel.grid.major =
          element_line(color = gray(.5), linetype = "dashed", linewidth = 0.2),
        panel.background = element_rect(fill = "aliceblue"))

districts <- plot_india("districts") +
  geom_sf(fill= "gray") +
  theme(panel.grid.major =
          element_line(color = gray(.5), linetype = "dashed", linewidth = 0.2),
        panel.background = element_rect(fill = "aliceblue"))

cowplot::plot_grid(states, districts, nrow = 1)
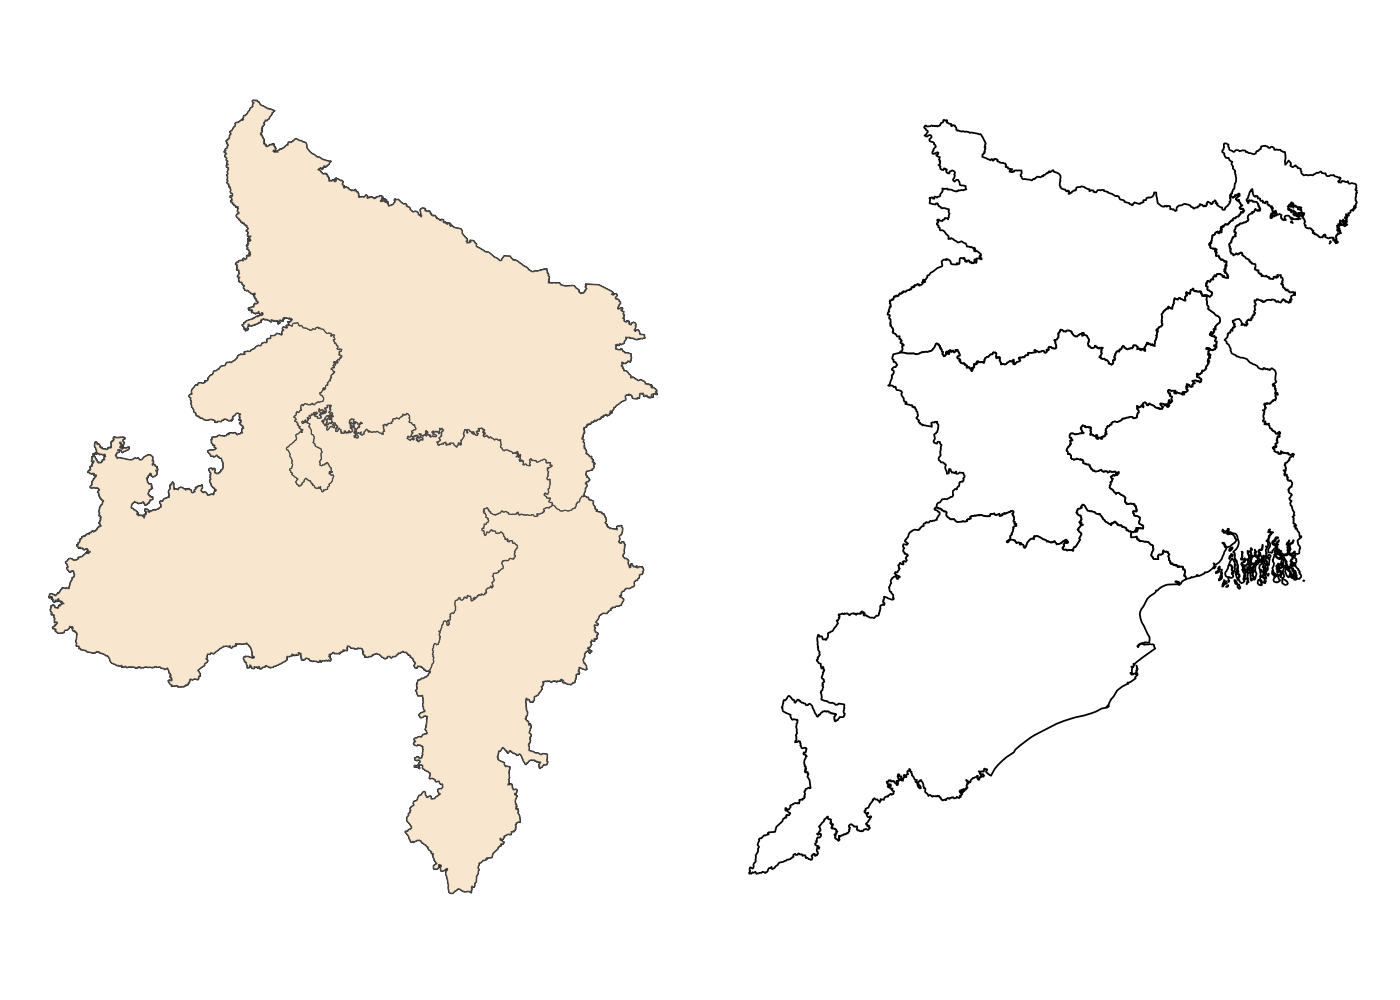
Visualize zones such as the Central or Eastern Zonal Councils:
central <- plot_india("states", include = .central, exclude = "UK", labels = TRUE) +
  geom_sf(fill= "antiquewhite")

east <- plot_india("states", include = .east, labels = FALSE)

cowplot::plot_grid(central, east, nrow = 1)
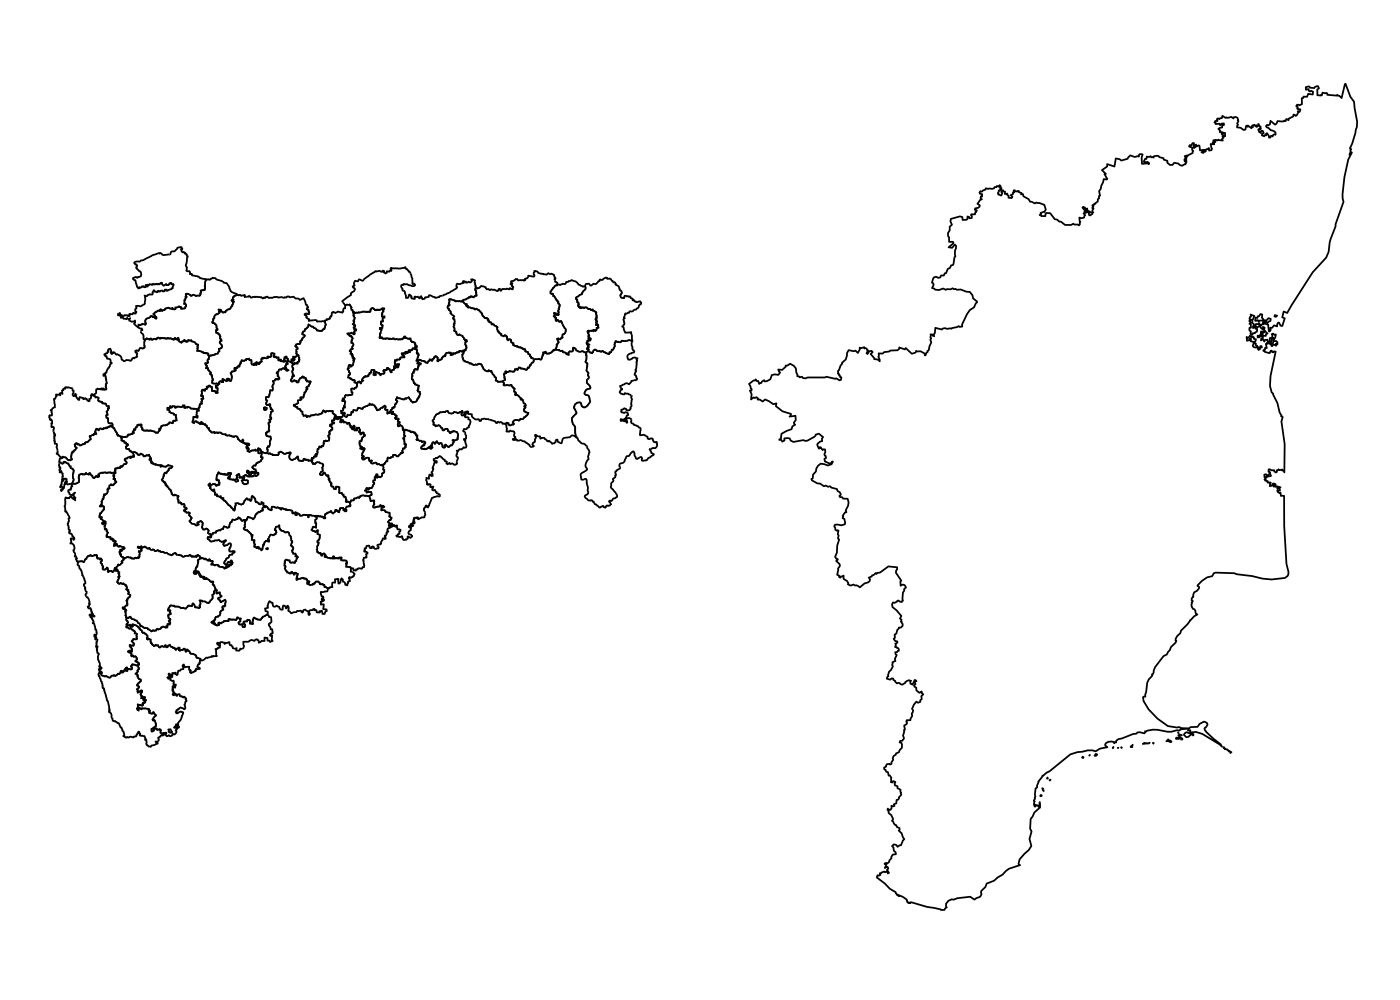
Visualize individual states such as the West Bengal or Tamil Nadu:
mh <- plot_india("districts", include = "MH")

tn <- plot_india("state", include = "Tamil Nadu", labels = FALSE)

cowplot::plot_grid(mh, tn, nrow = 1)
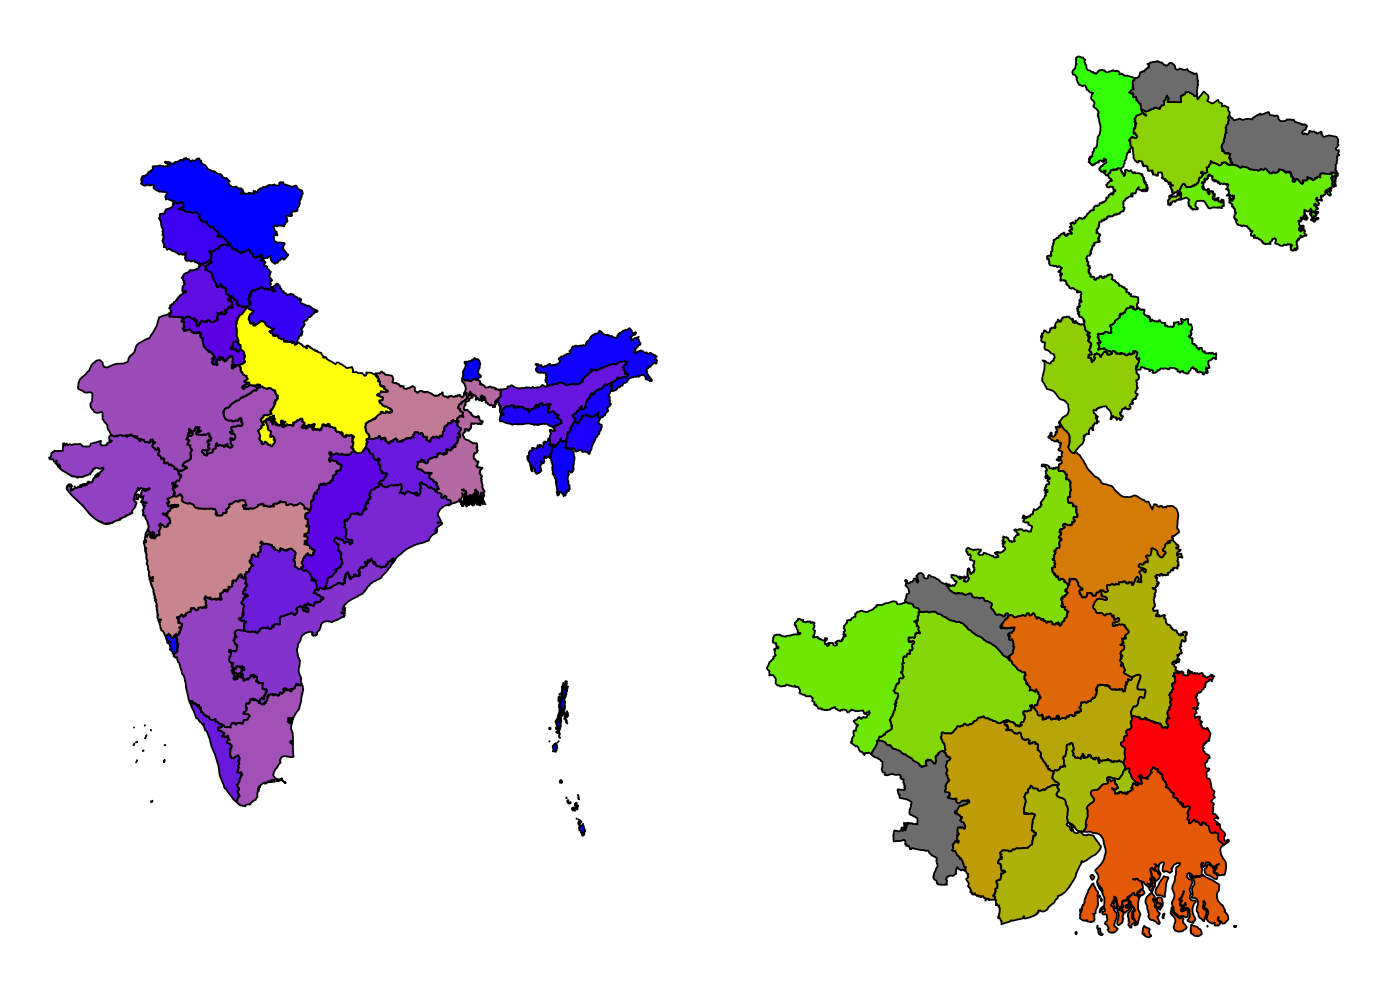
Use your data for visualizations as well:
statepop2011 <- plot_india("states", data = statepop, values = "pop_2011") +
  scale_fill_continuous(low = "blue", high = "yellow", guide = "none")

wbpop2011 <- plot_india("districts", data = wb_2011, values = "pop_2011", include = "WB") +
  scale_fill_continuous(low = "green", high = "red", guide = "none")

cowplot::plot_grid(statepop2011, wbpop2011, nrow = 1)
These binaries (installable software) and packages are in development.
They may not be fully stable and should be used with caution. We make no claims about them.
Health stats visible at Monitor.