
The hardware and bandwidth for this mirror is donated by dogado GmbH, the Webhosting and Full Service-Cloud Provider. Check out our Wordpress Tutorial.
If you wish to report a bug, or if you are interested in having us mirror your free-software or open-source project, please feel free to contact us at mirror[@]dogado.de.


lwpls implements locally-weighted partial least squares (LW-PLS) for the tidymodels ecosystem.
LW-PLS is a just-in-time learning method used in chemometrics and process monitoring (soft sensors). Instead of fitting a single global model, it builds a dedicated weighted PLS model around each new sample, where every training sample is weighted by its similarity to that sample. A linear method can therefore capture nonlinear and time-varying relationships.
lwpls(): a parsnip model for
regression (one or more outcomes) and
classification (LW-PLS-DA).similarity = "covariance").set_engine("lwpls", robust = TRUE)), and
sparse local models that select their own predictors
(sparsity), with the trimmed_rmse() metric to
tune robust models on contaminated data.localization() and similarity() are tuning
parameters, and all values of num_comp are evaluated from a
single fit (the “submodel trick”).lwpls_fit(): a standalone hardhat modeling function with
matrix, data frame, formula and recipe interfaces.lwpls_local()) with publication-ready ggplot2 plots:
reliability of each prediction (applicability domain), local regression
vectors along the spectrum, robust weights that point to wrong reference
values, and wavelengths selected by sparse models.Install a prebuilt binary from r-universe, which needs no compiler:
install.packages(
  "lwpls",
  repos = c("https://christiangoueguel.r-universe.dev", "https://cloud.r-project.org")
)
Or build the development version from GitHub with:
# install.packages("pak")
pak::pak("ChristianGoueguel/lwpls")
Building from source compiles C++ code, so it needs the R compiler tools. On macOS, that includes gfortran from https://mac.r-project.org/tools/.
Predict the water content of meat samples from their near-infrared spectra and tune both hyperparameters with cross-validation:
library(tidymodels)
library(lwpls)

data(meats, package = "modeldata")
meats <- meats |> select(-fat, -protein)set.seed(123)
meats_split <- initial_split(meats, prop = 0.75)
meats_folds <- vfold_cv(training(meats_split), v = 5)
lwpls_wflow <- workflow(
water ~ .,
lwpls(
num_comp = tune(),
localization = tune()
) |>
set_mode("regression")
)
lwpls_grid <- grid_regular(
num_comp(c(1, 15)),
localization(),
levels = c(num_comp = 15, localization = 8)
)
lwpls_res <- tune_grid(lwpls_wflow, meats_folds, grid = lwpls_grid)show_best(lwpls_res, metric = "rmse", n = 3)
#> # A tibble: 3 × 8
#> num_comp localization .metric .estimator mean n std_err .config
#> <int> <dbl> <chr> <chr> <dbl> <int> <dbl> <chr>
#> 1 10 0.5 rmse standard 1.66 5 0.156 pre0_mod077_post0
#> 2 13 0.5 rmse standard 1.68 5 0.198 pre0_mod101_post0
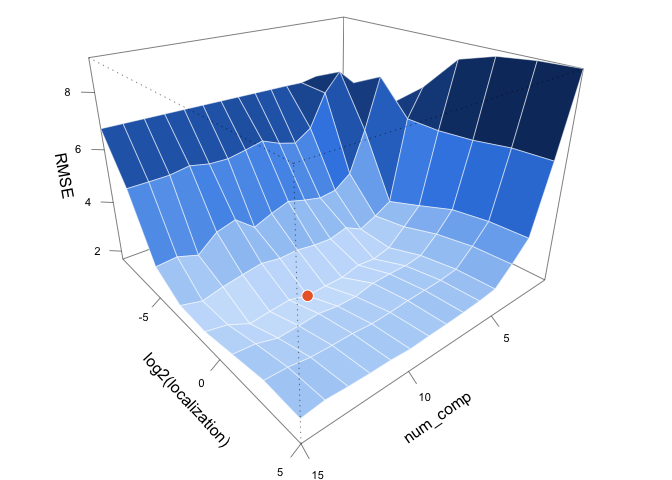
#> 3 9 0.5 rmse standard 1.70 5 0.174 pre0_mod069_post0The 120 candidate models are evaluated with only 8 fits per resample. Their cross-validated RMSE forms a surface over the two hyperparameters, with a valley between very local models and global PLS (the best model is the orange point):
rmse_grid <- lwpls_res |>
  collect_metrics() |>
  filter(.metric == "rmse") |>
  select(num_comp, localization, rmse = mean)
best <- slice_min(rmse_grid, rmse)
# color each facet by its mean RMSE
rmse_mat <- with(rmse_grid, tapply(rmse, list(num_comp, log2(localization)), mean))
n <- dim(rmse_mat)
facets <- (rmse_mat[-1, -1] + rmse_mat[-1, -n[2]] + rmse_mat[-n[1], -1] + rmse_mat[-n[1], -n[2]]) / 4
blues <- colorRampPalette(c("#cde2fb", "#3987e5", "#0d366b"))(50)
par(mar = c(1, 0, 0, 0))
view <- persp(
x = as.numeric(rownames(rmse_mat)),
y = as.numeric(colnames(rmse_mat)),
z = rmse_mat,
theta = 140,
phi = 25,
expand = 0.7,
ticktype = "detailed",
col = blues[cut(facets, 50)],
border = "white",
lwd = 0.5,
xlab = "num_comp",
ylab = "log2(localization)",
zlab = "RMSE", cex.axis = 0.7
)
points(
trans3d(best$num_comp, log2(best$localization), best$rmse, view),
pch = 21,
bg = "#eb6834",
col = "white",
cex = 1.6
)
The final model is evaluated on the test set:
lwpls_wflow |>
  finalize_workflow(select_best(lwpls_res, metric = "rmse")) |>
  last_fit(meats_split) |>
  collect_metrics()
#> # A tibble: 2 × 4
#>   .metric .estimator .estimate .config
#>   <chr>   <chr>          <dbl> <chr>
#> 1 rmse    standard       1.38  pre0_mod0_post0
#> 2 rsq     standard       0.978 pre0_mod0_post0
Each prediction comes from its own local model.
lwpls_local() returns these models with their diagnostics;
for example, their regression vectors along the spectrum (100 channels
between 850 and 1050 nm) show how the bands used change with the water
content:
final_fit <- lwpls_wflow |>
  finalize_workflow(select_best(lwpls_res, metric = "rmse")) |>
  fit(training(meats_split))

final_fit |>
  lwpls_local(testing(meats_split), wavelength = seq(850, 1050, length.out = 100)) |>
  plot_coefficients(axis_label = "Wavelength (nm)")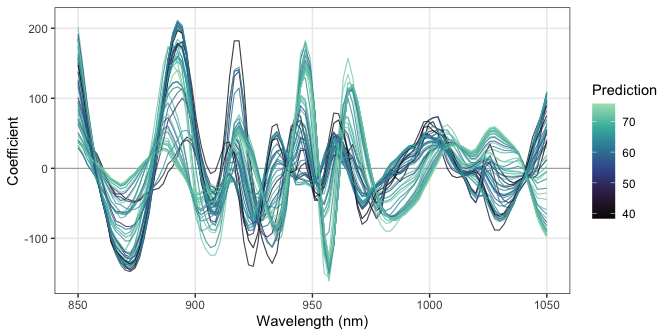
See vignette("lwpls") for more details, including the
comparison with global PLS and classification,
vignette("robust-sparse") for robust and sparse local
models, and vignette("diagnostics") for the diagnostic
plots.
For a query sample \(x_q\), each training sample \(x_i\) receives the weight
\[\omega_i = \exp\left(-\frac{\lVert x_i - x_q \rVert}{\sigma_d \varphi}\right)\]
where \(\sigma_d\) is the standard
deviation of the distances and \(\varphi\) is the localization
parameter. A PLS model with num_comp components is then
fitted with these weights, and the query is projected onto it. Small
values of \(\varphi\) give very local
models; large values give global PLS.
These binaries (installable software) and packages are in development.
They may not be fully stable and should be used with caution. We make no claims about them.
Health stats visible at Monitor.