litReview:
An R package for plotting literature review results
The hardware and bandwidth for this mirror is donated by dogado GmbH, the Webhosting and Full Service-Cloud Provider. Check out our Wordpress Tutorial.
If you wish to report a bug, or if you are interested in having us mirror your free-software or open-source project, please feel free to contact us at mirror[@]dogado.de.
litReview:
An R package for plotting literature review results
litReview provides functions to summarize and visualize
categorical data from literature reviews. All plot functions return
standard ggplot objects you can customize with +.
Install the released version from CRAN:
install.packages("litReview")Or the development version from GitHub:
# install.packages("remotes")
remotes::install_github("sonsoleslp/litReview")library(litReview)
data(studies)reviewBar(studies, Design)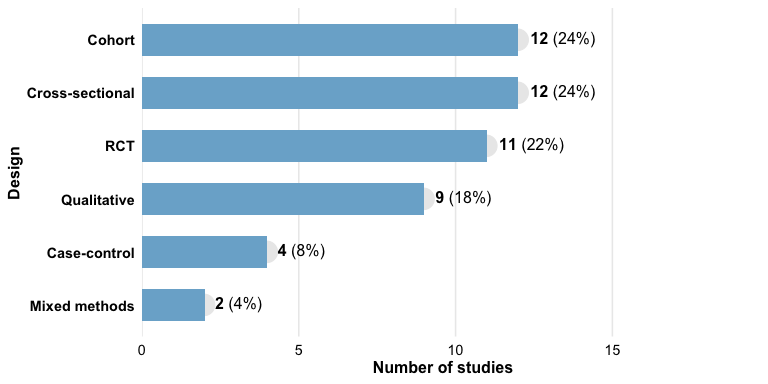
reviewBar(studies, Design, fill = "#59a14f") +
  ggplot2::labs(title = "Study Designs")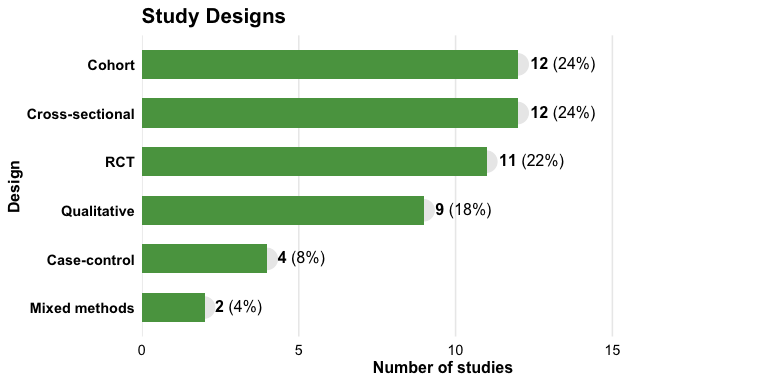
reviewBar(studies, Design, fill = PALETTE[2], studlabs = TRUE)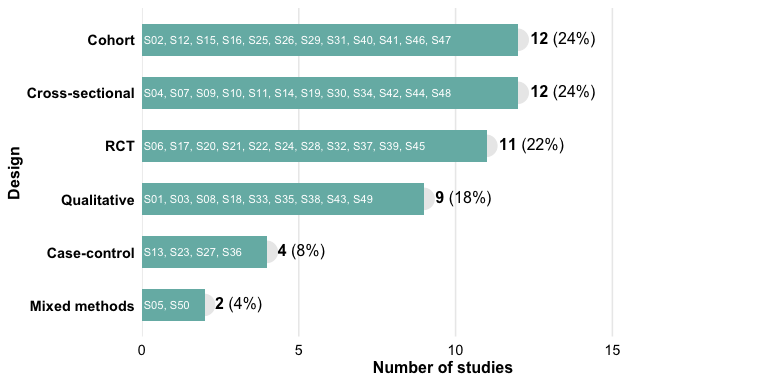
reviewStackedBar() compares the composition of one
category across another. By default each bar is scaled to 100% to
compare proportions:
reviewStackedBar(studies, Design, RiskOfBias)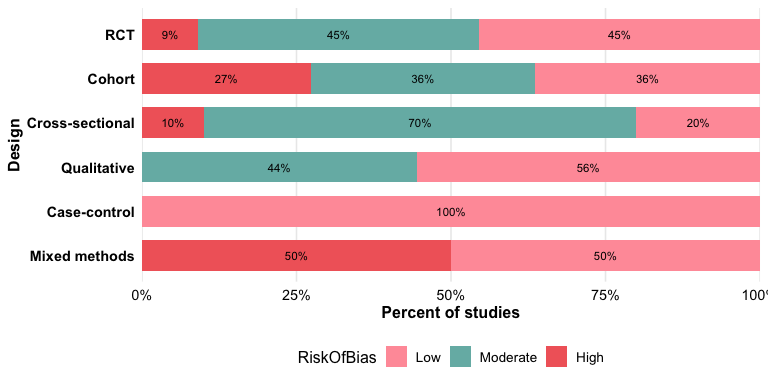
Use position = "stack" for raw counts:
reviewStackedBar(studies, Design, RiskOfBias, position = "stack")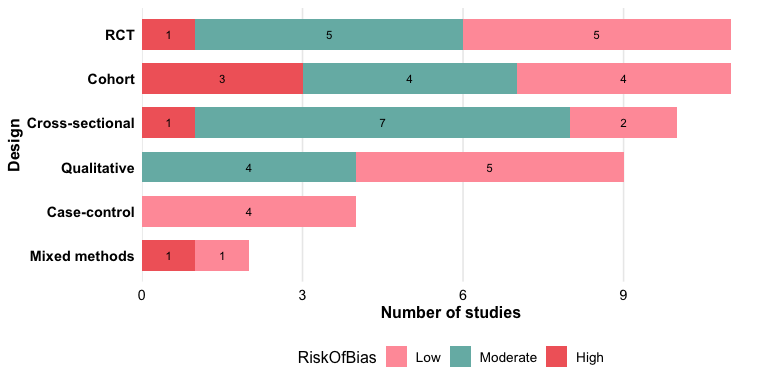
reviewHistogram() bins a numeric column; add
fill_by to stack by a group.
reviewHistogram(studies, SampleSize, bins = 15)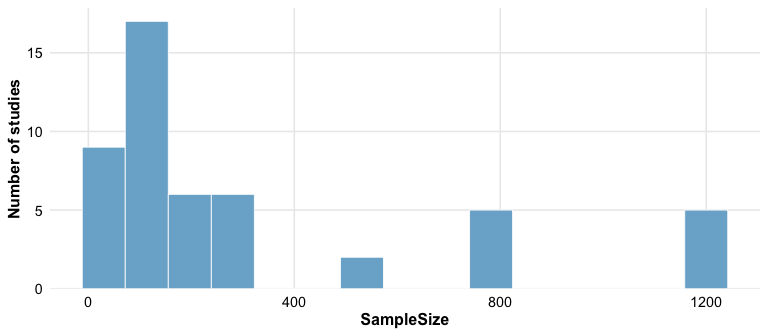
reviewWaffle(studies, Design, ncol = 10)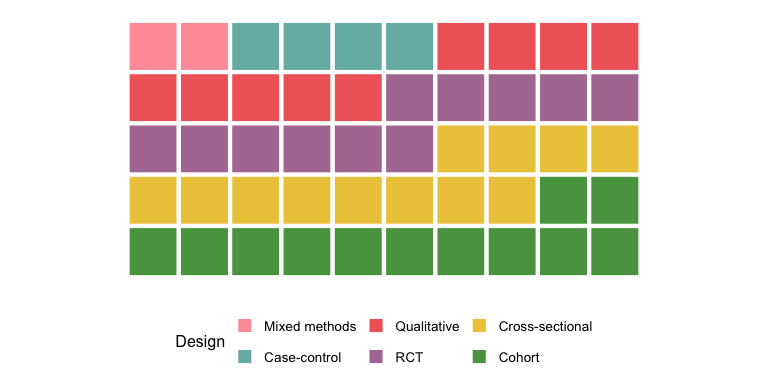
reviewPie(studies, Design)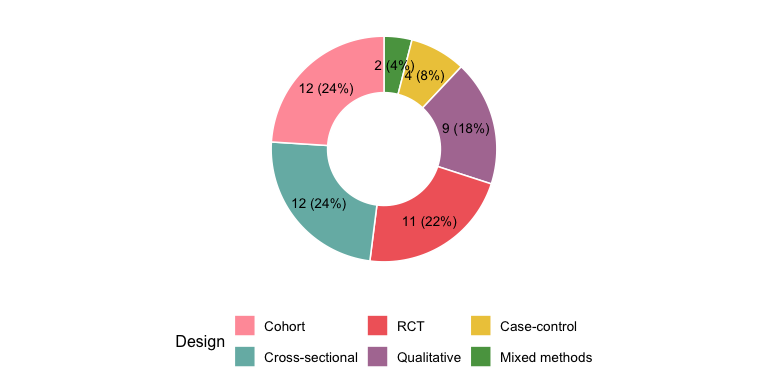
reviewOverlap(studies, Design, Outcome, fill = "#b07aa1")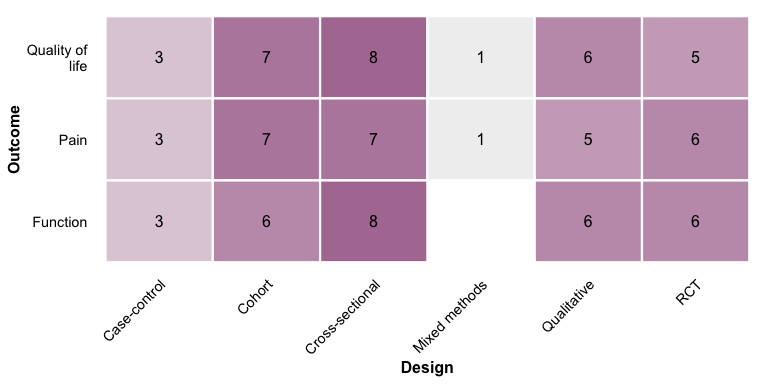
reviewUpset() shows how the values of a multi-value
column co-occur across studies — a scalable alternative to the pairwise
heatmap. Requires the ggupset package.
reviewUpset(studies, Outcome, fill = "#f16769")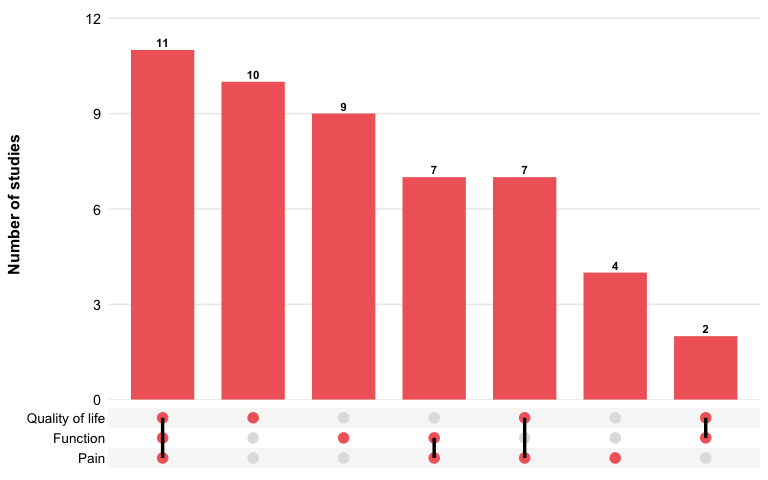
reviewAlluvial(studies, c("Design", "Outcome"), labels = "prop")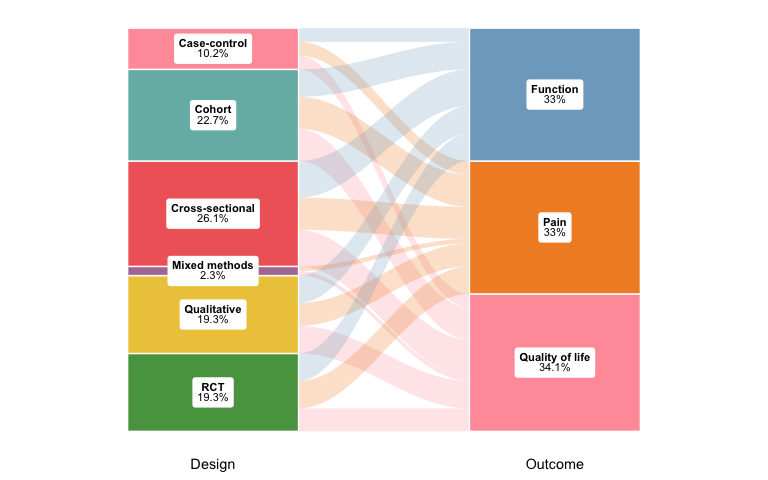
reviewTrend(studies, Design)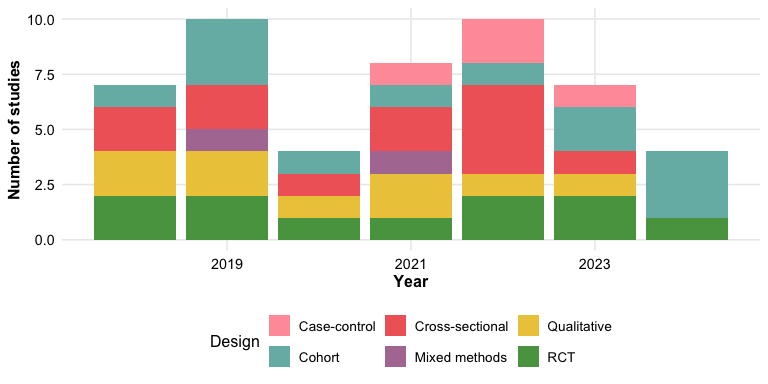
reviewMap(studies)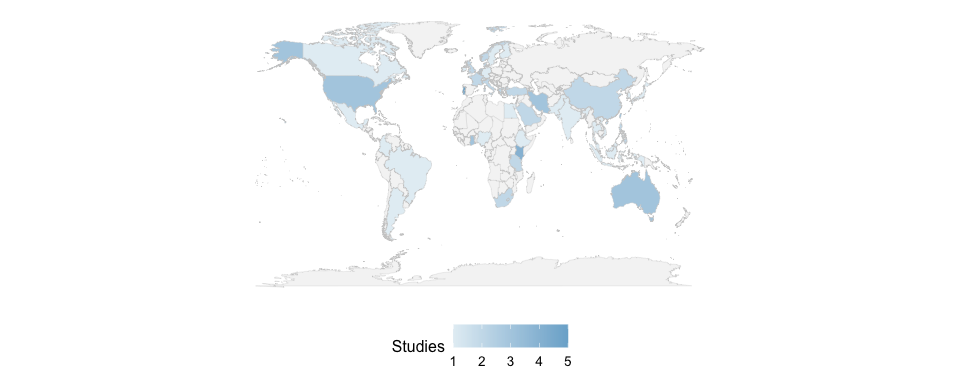
reviewTreemap(studies, Design)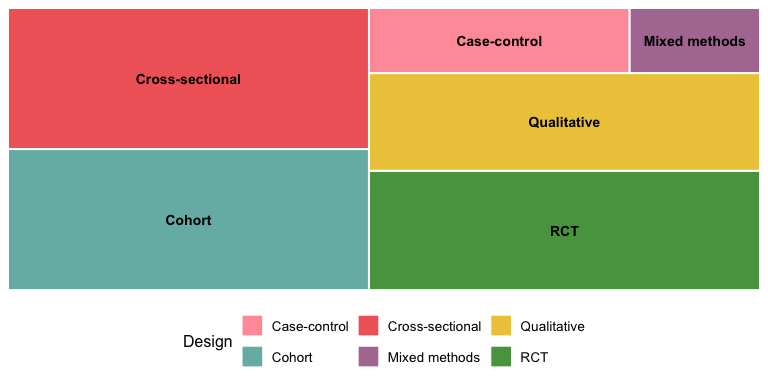
reviewTreemap(studies, Intervention, color_by = InterventionType)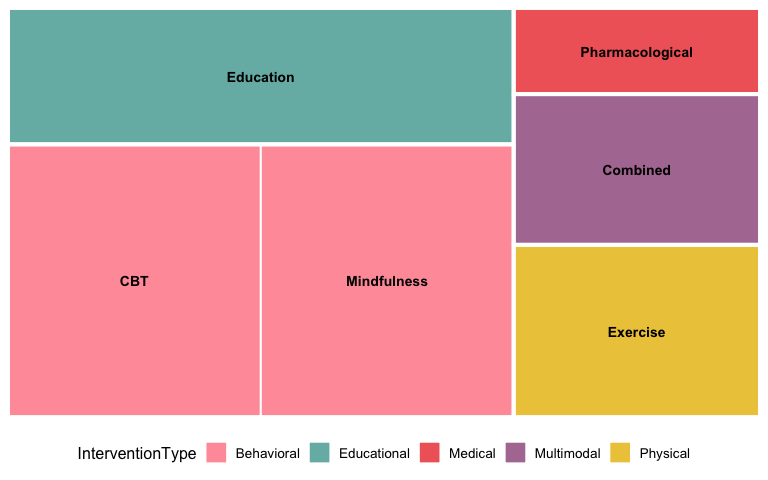
reviewMatrix() shows a study-by-criteria evidence
matrix: a tile wherever a study addresses a criterion, coloured by a
study attribute with the coding level inside.
criteria <- c("Randomization", "Blinding", "SampleJustification",
              "AttritionReported", "EthicsApproval", "EffectSize")
reviewMatrix(studies[1:20, ], criteria, color_by = "PubType",
             levels = c(F = "Full", P = "Partial", M = "Mention"))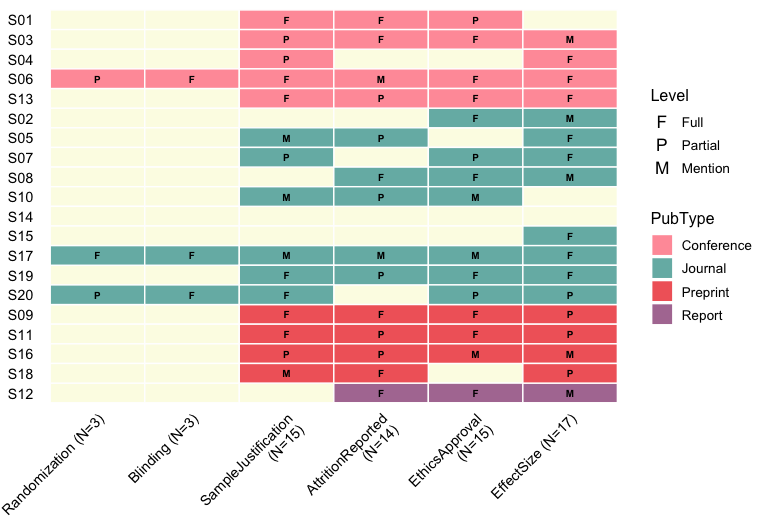
reviewTree() draws a left-to-right hierarchy from
columns given in order, listing the studies at each leaf.
reviewTree(studies, c("InterventionType", "Intervention"), study_id = Author)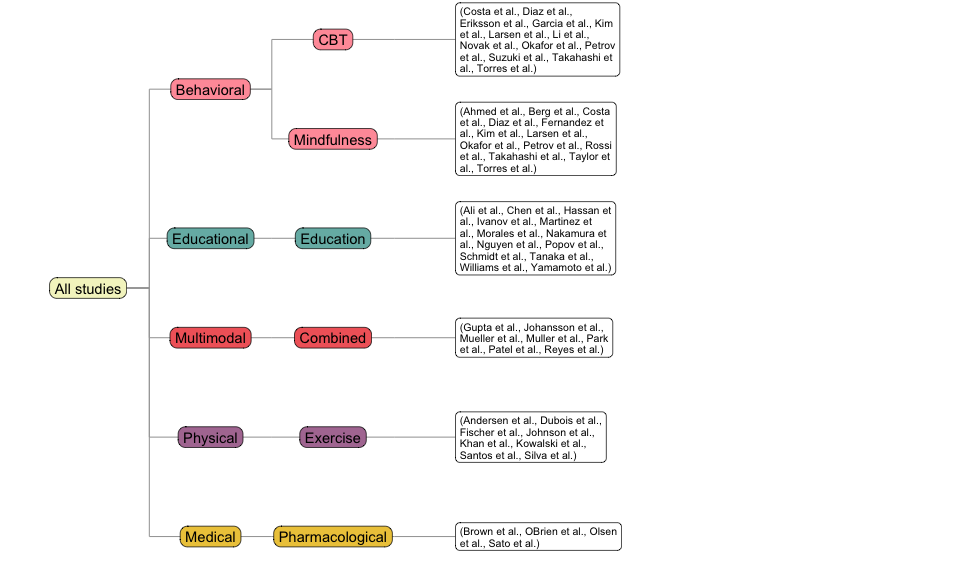
reviewTable(studies, Design, study_id = "Author")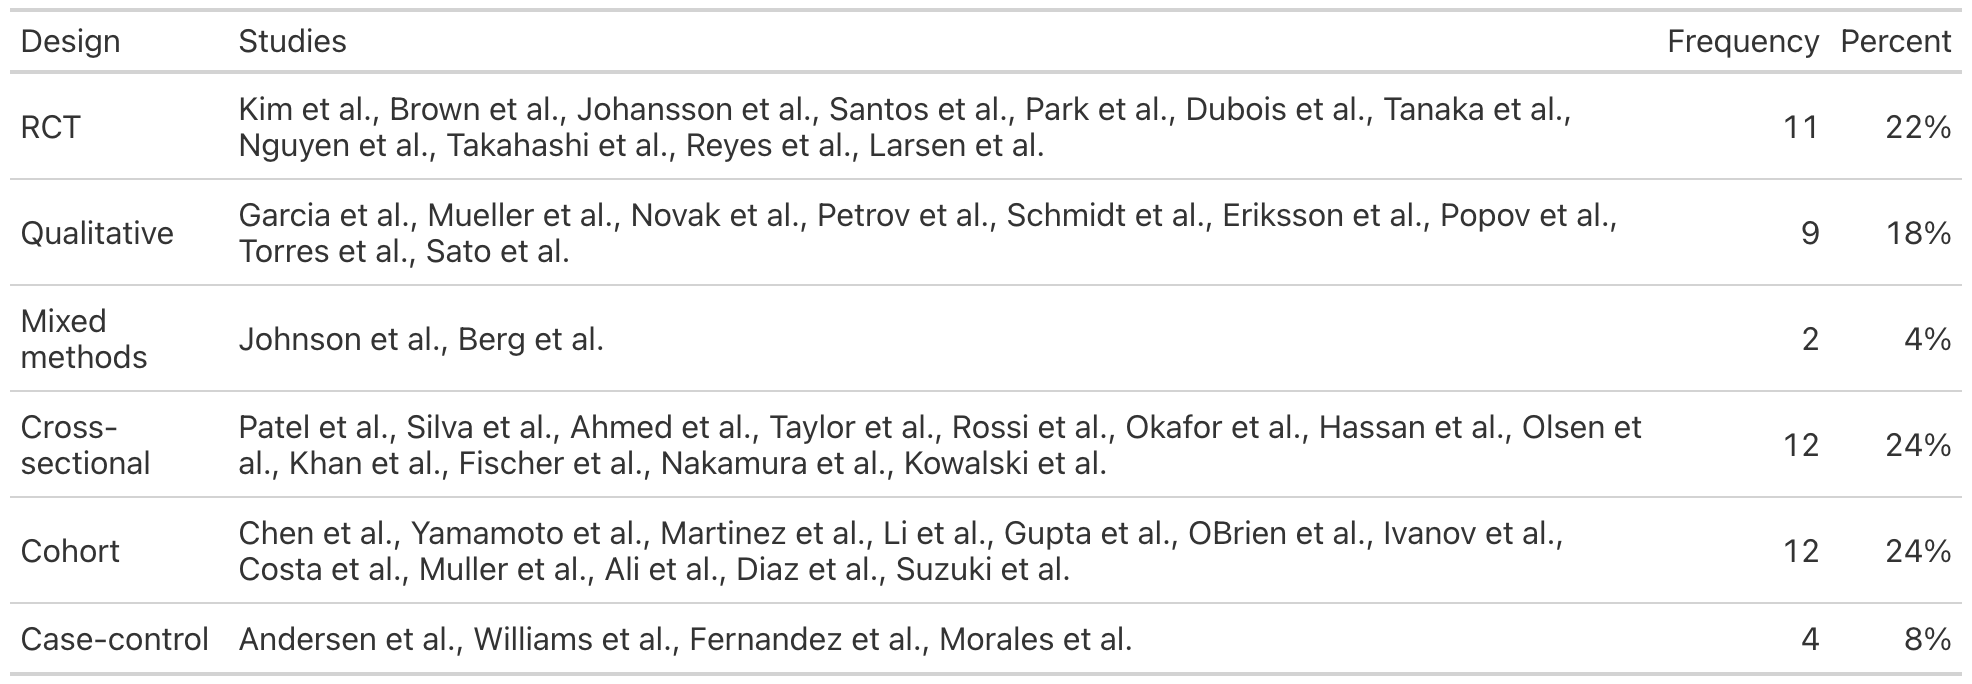
df_na <- data.frame(
  StudyID = paste0("S", 1:8),
  Design  = c("RCT", "Cohort", NA, "RCT", "Case-control", NA, "RCT", "Cohort"),
  stringsAsFactors = FALSE
)
reviewBar(df_na, Design, na.rm = FALSE, na_label = "Missing", na_last = TRUE)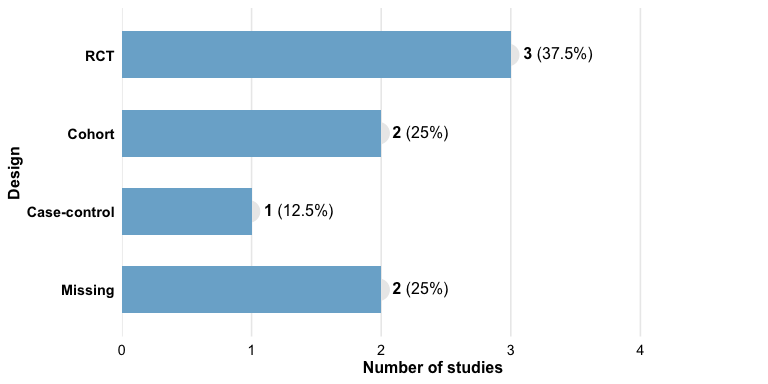
These binaries (installable software) and packages are in development.
They may not be fully stable and should be used with caution. We make no claims about them.
Health stats visible at Monitor.