The hardware and bandwidth for this mirror is donated by dogado GmbH, the Webhosting and Full Service-Cloud Provider. Check out our Wordpress Tutorial.
If you wish to report a bug, or if you are interested in having us mirror your free-software or open-source project, please feel free to contact us at mirror[@]dogado.de.
![]()
![]()
![]()
This package provides extensions to the leaflet package to customize leaflet legends without adding an outside css file to the output to style legends. The legend extensions allow the user to add images to legends, style the labels of the legend items, change orientation of the legend items, use different symbologies, and style axis ticks. Syntax and style is consistent with the leaflet package. Helper functions are provided to create map symbols for plotting as well.
You can install the released version of leaflegend from CRAN with:
install.packages("leaflegend")Install the development version with:
devtools::install_github("tomroh/leaflegend")default


pch


special

Use addLegend*() to create easily customizable legends
for leaflet.
library(leaflet)
library(leaflegend)
set.seed(21)
data("gadmCHE")
gadmCHE@data$x <- sample(c('A', 'B', 'C'), nrow(gadmCHE@data), replace = TRUE)
factorPal <- colorFactor(c('#1f77b4', '#ff7f0e' , '#2ca02c'), gadmCHE@data$x)
n <- 10
awesomeMarkers <- data.frame(
  marker = sample(c('Font Awesome', 'Ionic', 'Glyphicon'), n, replace = TRUE),
  lng = runif(n, gadmCHE@bbox[1,1], gadmCHE@bbox[1,2]),
  lat = runif(n, gadmCHE@bbox[2,1], gadmCHE@bbox[2,2])
)
n2 <- 30
symbolMarkers <- data.frame(
  x = runif(n2, 0, 100),
  y = runif(n2, 10, 30),
  lng = runif(n2, gadmCHE@bbox[1,1], gadmCHE@bbox[1,2]),
  lat = runif(n2, gadmCHE@bbox[2,1], gadmCHE@bbox[2,2])
)
numericPal <- colorNumeric(hcl.colors(10, palette = 'zissou'),
                           symbolMarkers$y)
iconSet <- awesomeIconList(
  `Font Awesome` = makeAwesomeIcon(icon = "font-awesome", library = "fa",
                                   iconColor = 'rgb(192, 255, 0)',
                                   markerColor = 'lightgray',
                                   squareMarker = TRUE, iconRotate = 30
  ),
  Ionic = makeAwesomeIcon(icon = "ionic", library = "ion",
                          iconColor = 'gold', markerColor = 'gray',
                          squareMarker = FALSE),
  Glyphicon = makeAwesomeIcon(icon = "plus-sign", library = "glyphicon",
                              iconColor = '#ffffff',
                              markerColor = 'black', squareMarker = FALSE)
)
leaflet() |>
  addTiles() |>
  addPolygons(data = gadmCHE, color = ~factorPal(x), fillOpacity = .5,
              opacity = 0, group = 'Polygons') |>
  addLegendFactor(pal = factorPal, shape = 'polygon', fillOpacity = .5,
                  opacity = 0, values = ~x, title = 'addLegendFactor',
                  position = 'topright', data = gadmCHE, group = 'Polygons') |>
  addAwesomeMarkers(data = awesomeMarkers, lat = ~lat, lng = ~lng,
                    icon = ~iconSet[marker],
                    group = 'Awesome Icons') |>
  addLegendAwesomeIcon(iconSet = iconSet, title = 'addLegendAwesomeIcon',
                       position = 'bottomleft',
                       group = 'Awesome Icons') |>
  addSymbolsSize(data = symbolMarkers, fillOpacity = .7, shape = 'plus',
                 values = ~x, lat = ~lat, lng = ~lng, baseSize = 20,
                 fillColor = ~numericPal(y), color = 'black',
                 group = 'Symbols') |>
  addLegendSize(pal = numericPal, shape = 'plus', color = 'black',
                fillColor = 'transparent', baseSize = 20, fillOpacity = .7,
                values = ~x, orientation = 'horizontal',
                title = 'addSizeLegend', position = 'bottomright',
                group = 'Symbols', data = symbolMarkers) |>
  addLegendNumeric(pal = numericPal, values = ~y, title = 'addLegendNumeric',
                   orientation = 'horizontal', fillOpacity = .7, width = 150,
                   height = 20, position = 'bottomright', group = 'Symbols',
                   data = symbolMarkers) |>
  addLayersControl(overlayGroups = c('Polygons', 'Awesome Icons', 'Symbols'),
                   position = 'topleft',
                   options = layersControlOptions(collapsed = FALSE))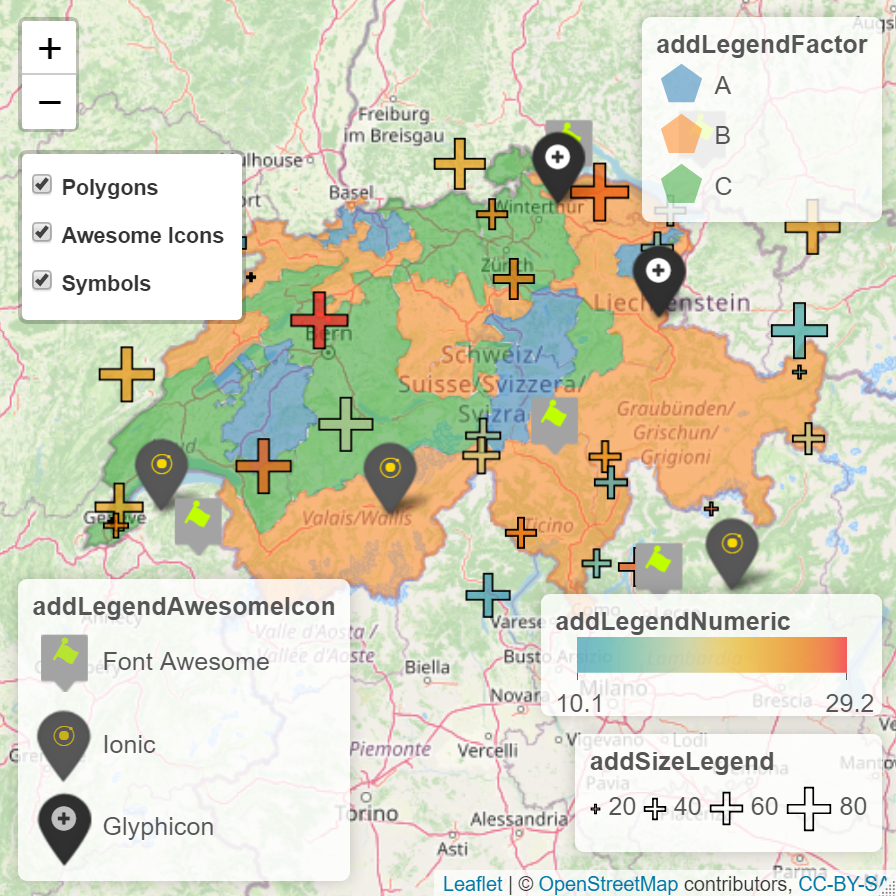
These binaries (installable software) and packages are in development.
They may not be fully stable and should be used with caution. We make no claims about them.
Health stats visible at Monitor.