The hardware and bandwidth for this mirror is donated by dogado GmbH, the Webhosting and Full Service-Cloud Provider. Check out our Wordpress Tutorial.
If you wish to report a bug, or if you are interested in having us mirror your free-software or open-source project, please feel free to contact us at mirror[@]dogado.de.
iotarelr provides routines and tools for assessing the quality of content analysis on the basis of the Iota Reliability Concept. The concept is inspired by item response theory and can be applied to any kind of content analysis which uses a standardized coding scheme and discrete categories. It is also applicable for content analysis conducted by artificial intelligence. The package provides reliability measures for the complete scale as well as for every single category. Analysis of subgroup-invariance and error corrections are implemented. This information can support the development process of a coding scheme and allows a detailed inspection of the quality of the generated data.
The tools are able to provide answers to the following questions:
A brief introduction on how to use the package can be found via Get started. Articles describing how to conduct advanced analysis can be found via Articles.
You can install the package from CRAN with:
install.packages("iotarelr")You can install the development version of iotarelr from GitHub with:
# install.packages("devtools")
devtools::install_github("FBerding/iotarelr")iotarelr calculates the following components of the Iota Reliability Concept.
On the level of every single category:
On the scale level:
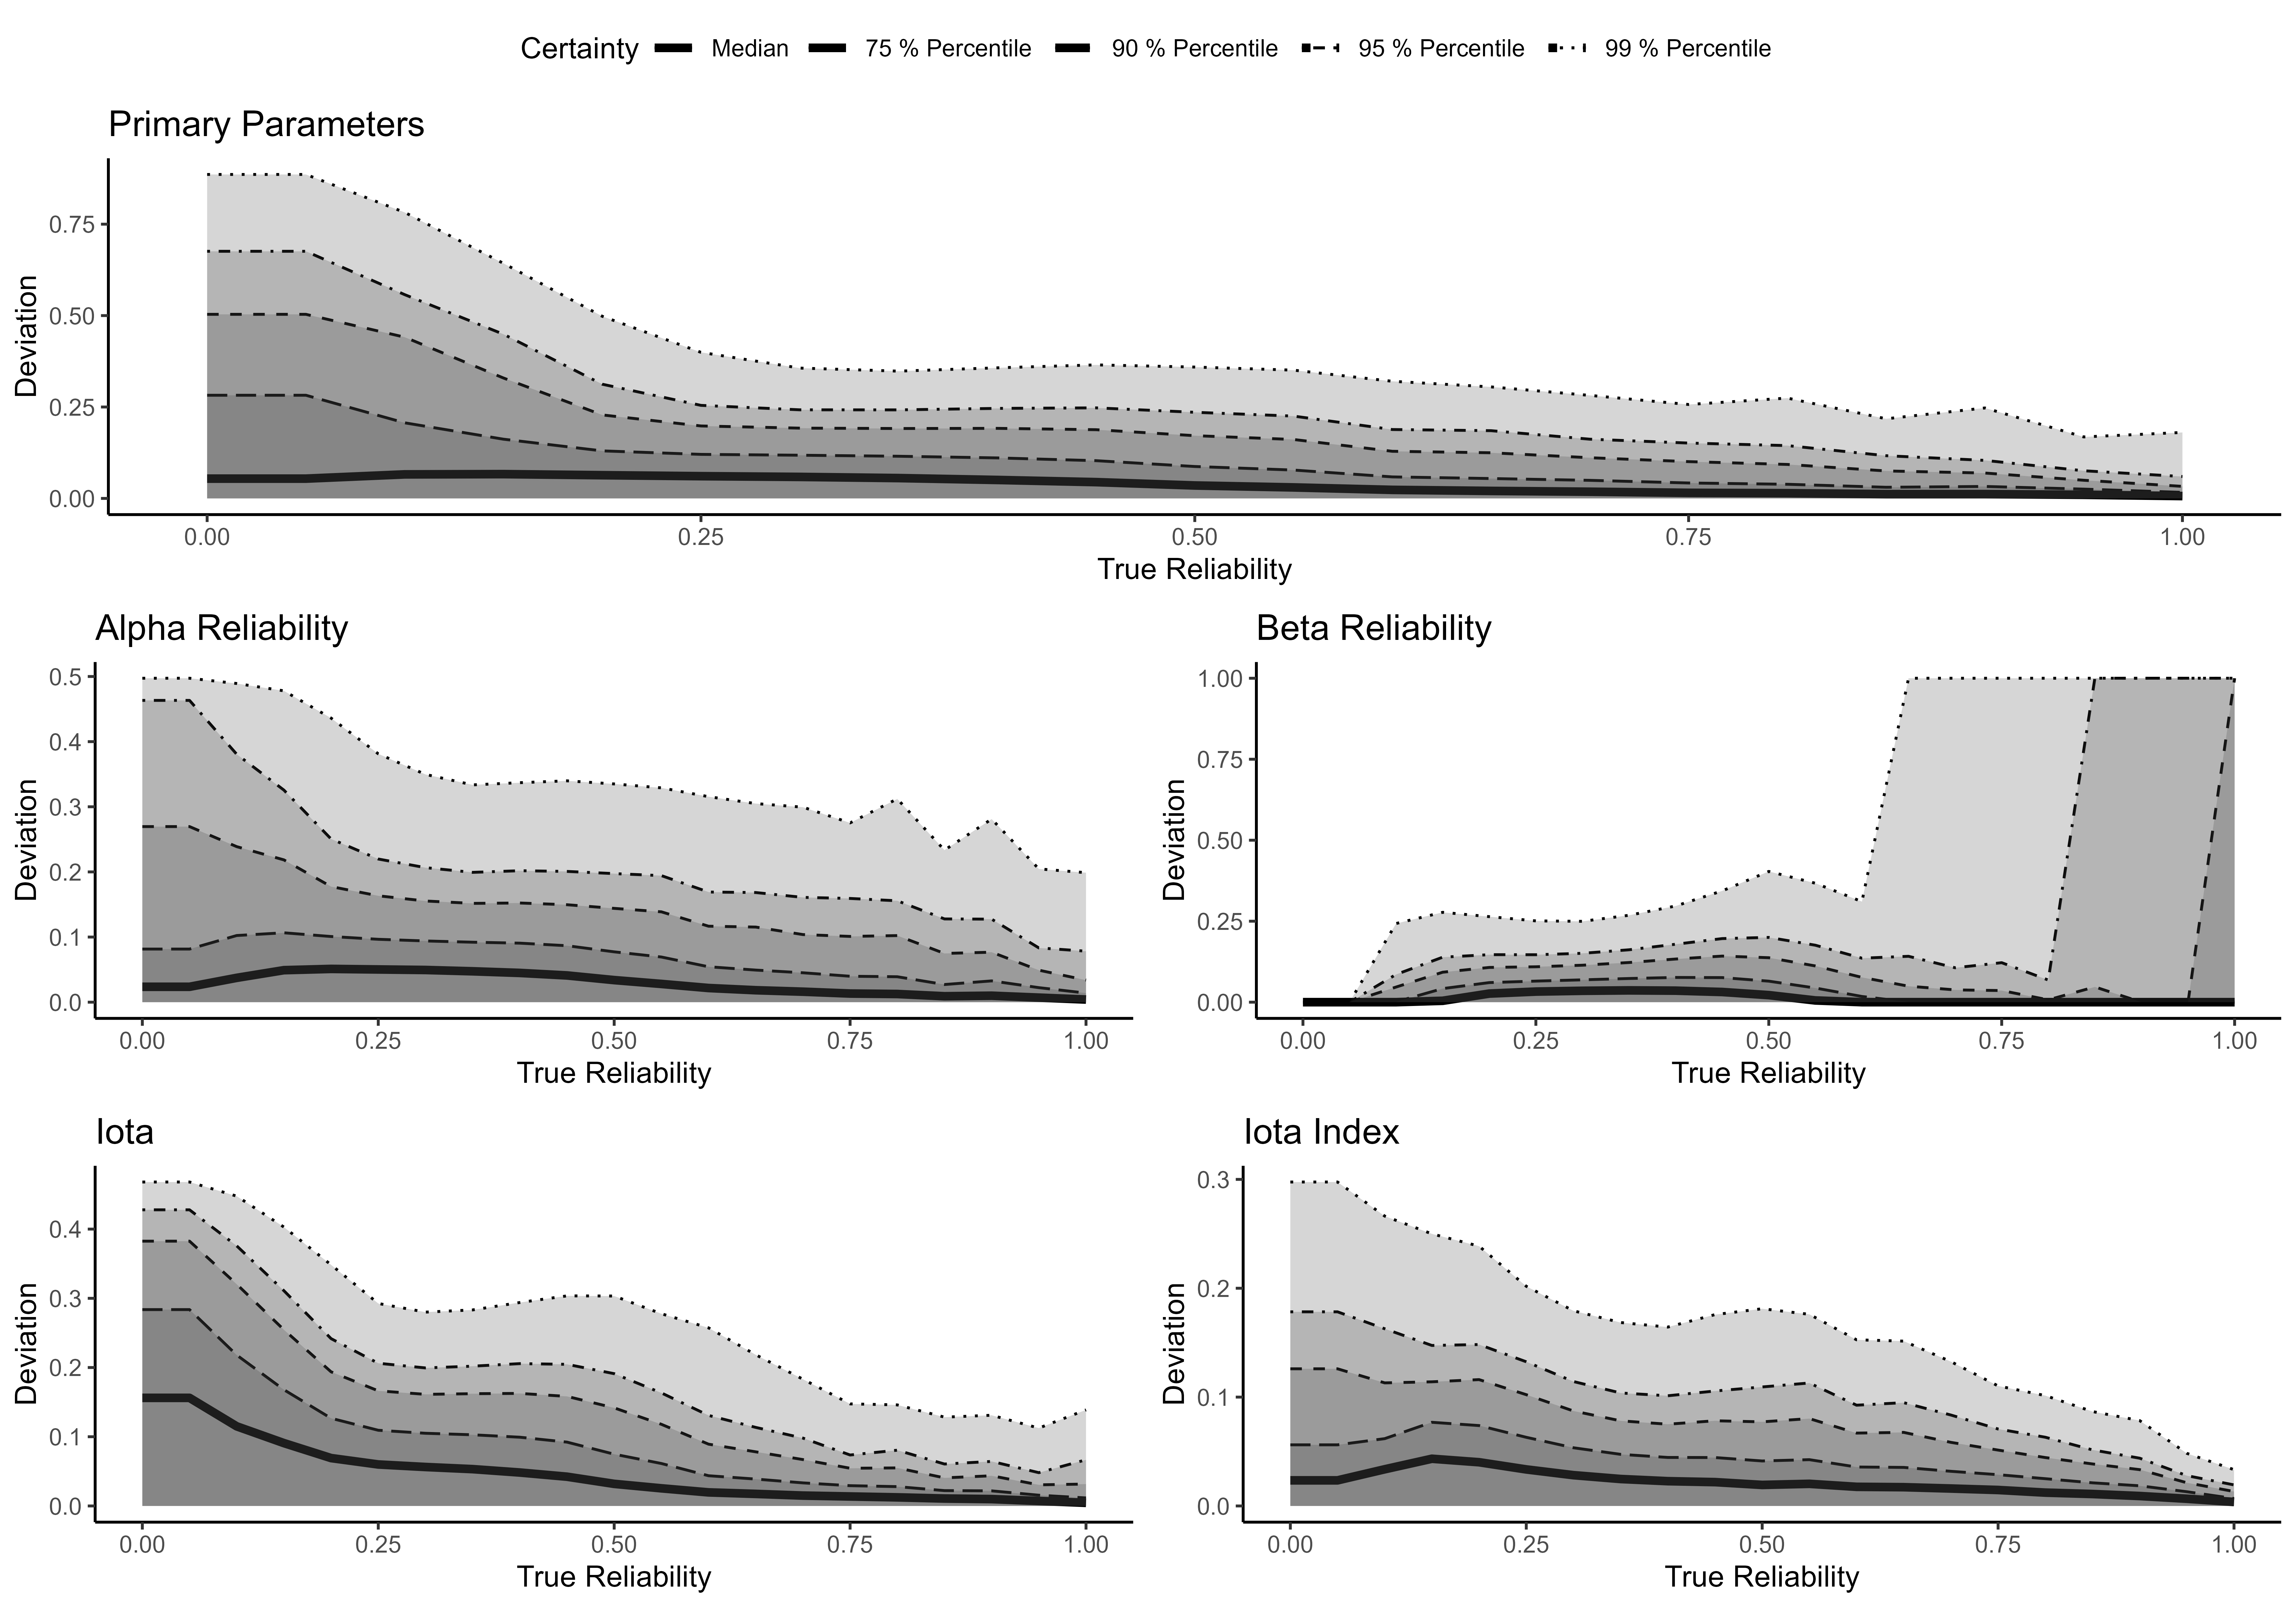
The parameter estimation of the components makes use of Maximum Likelihood Estimation (Expectation Maximization Algorithm), which comprises an additional conditioning stage. The following figure shows the extent to which the estimated parameters correspond to their true values based on a simulation study (Berding & Pargmann 2022).

In general, the parameter (Primary Parameters, Alpha and Beta Reliability) estimates do not deviate from their true values by more than 5 percentage points (see median in the figure). In most cases, Iota Index deviates no more than .043 from its true value. The estimates are more accurate, the greater the sample size and the more raters are involved in coding. Furthermore, the estimates are more accurate for higher values of true reliability.
Please note that the high deviation for Beta Reliability under the condition of very high reliability results from rare cases with perfect Alpha Reliability. For more details please refer to Berding & Pargmann (2022).
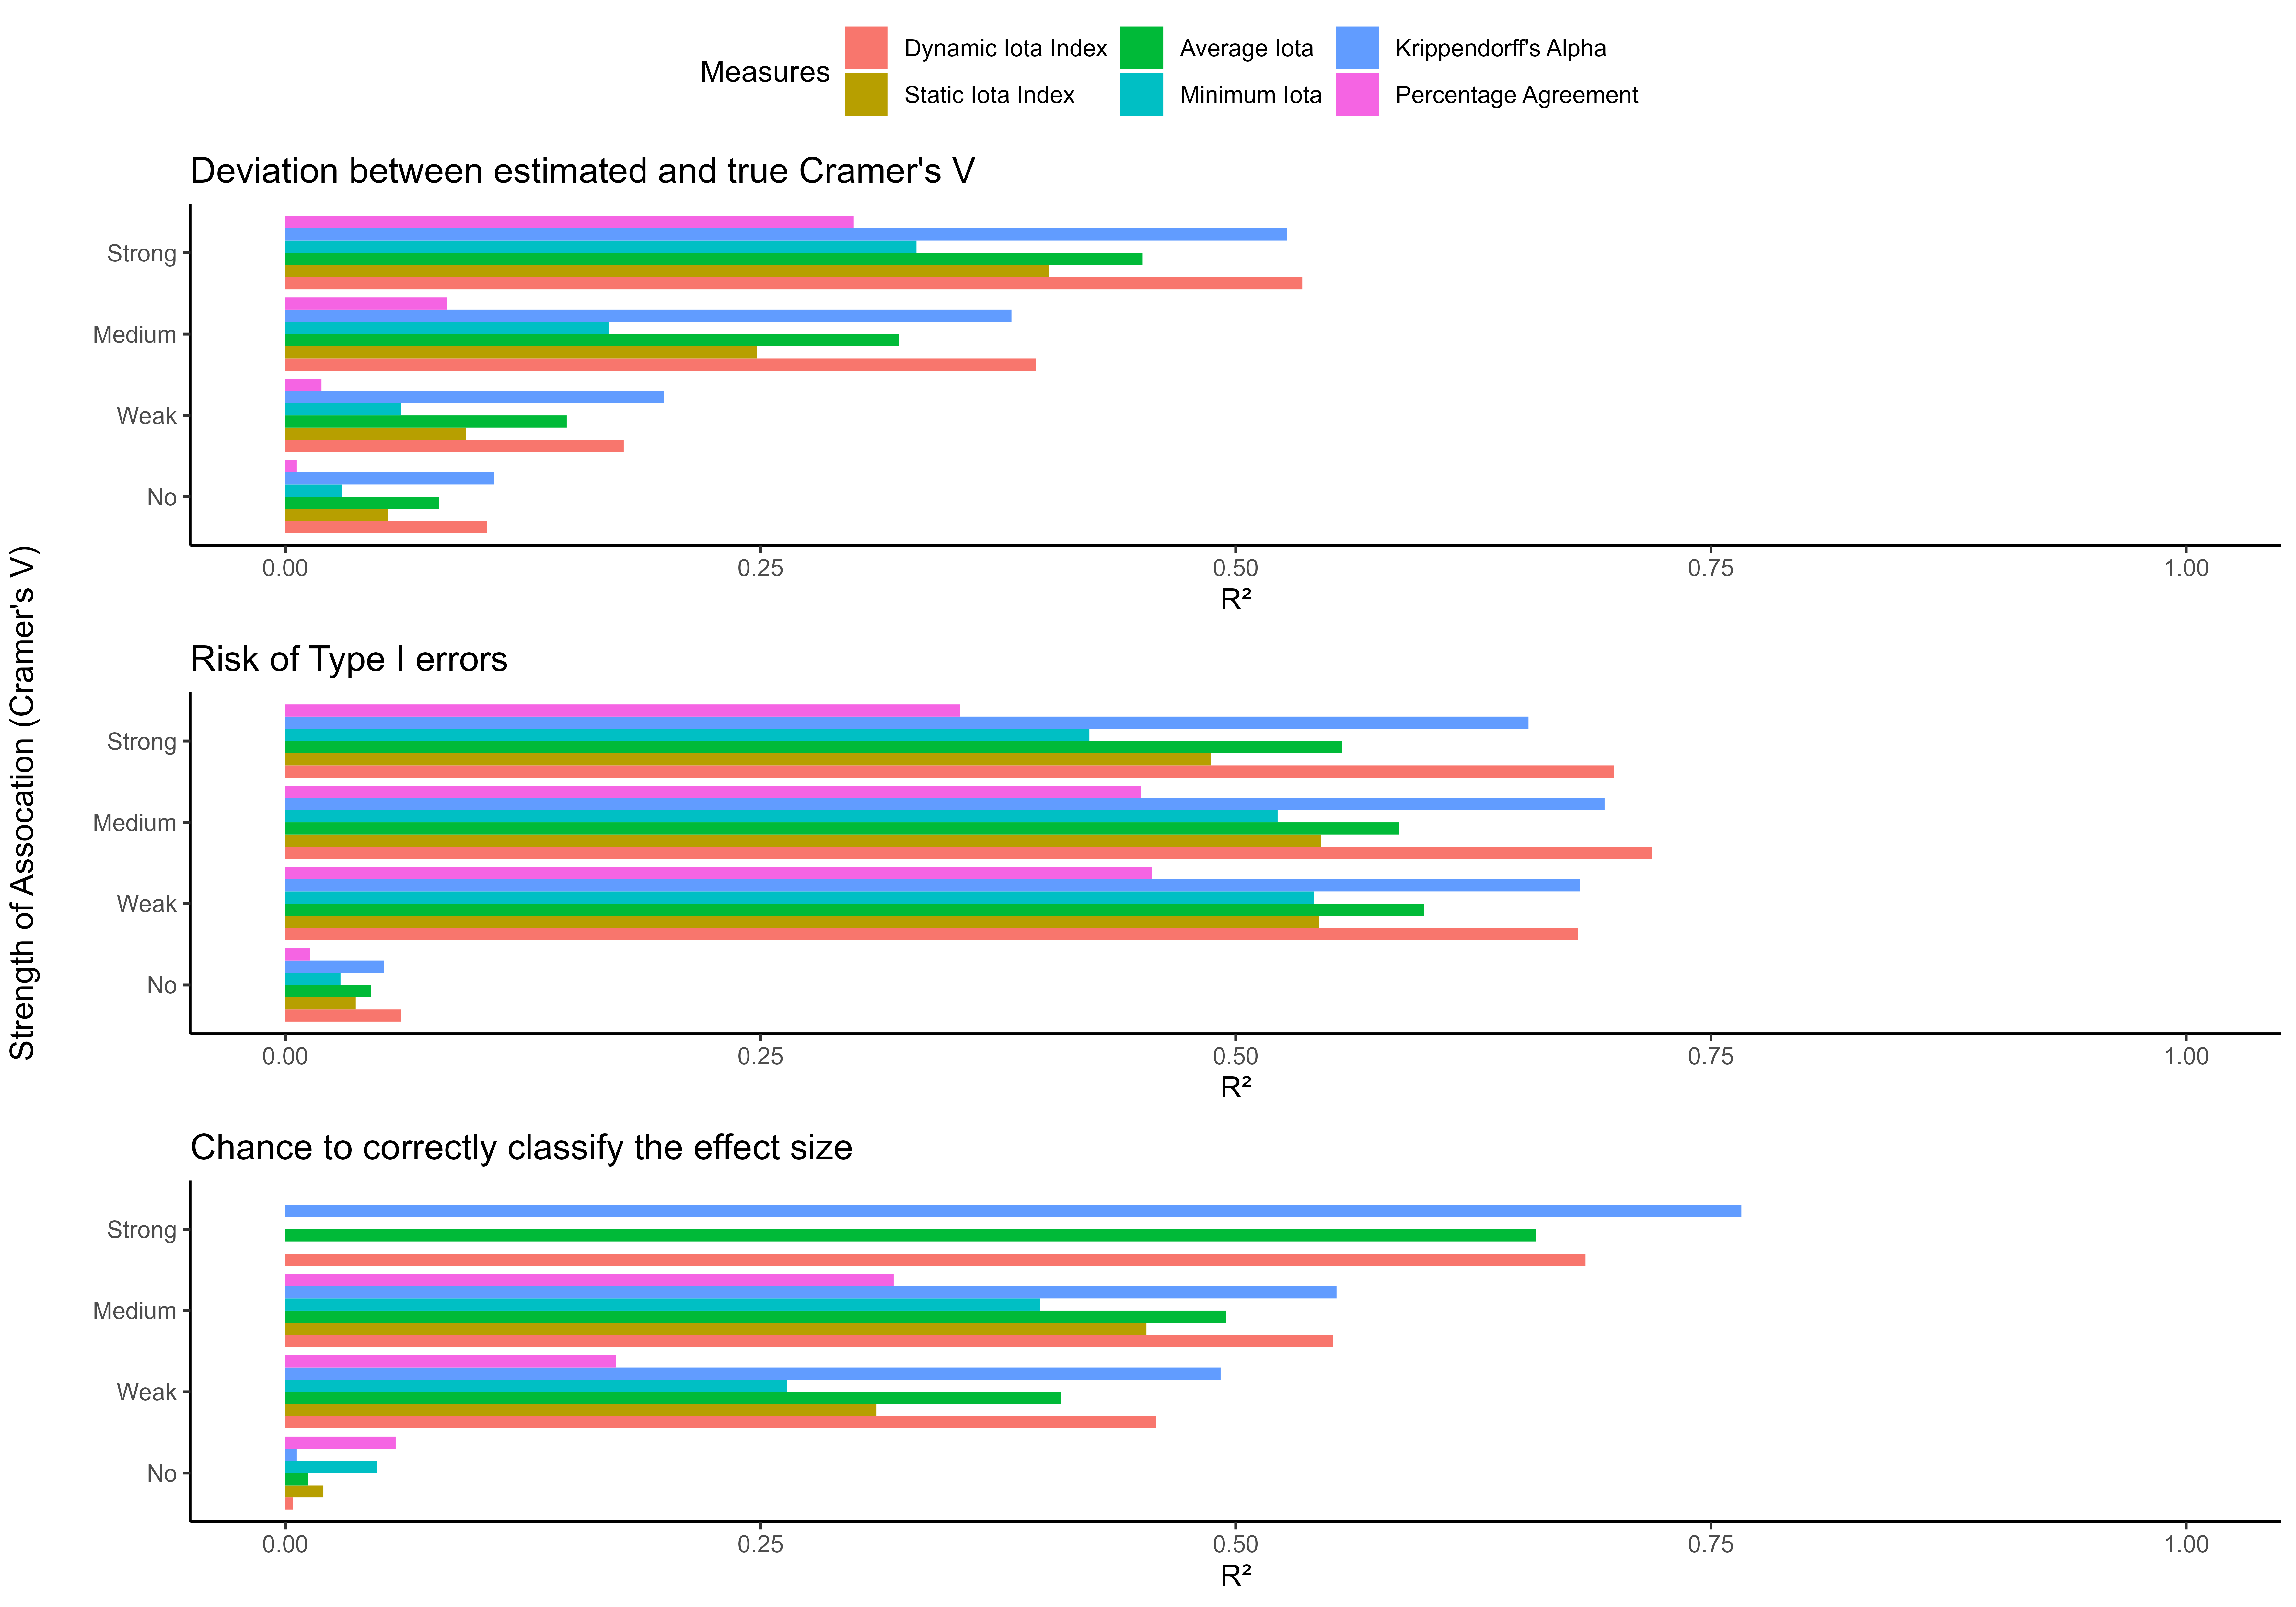
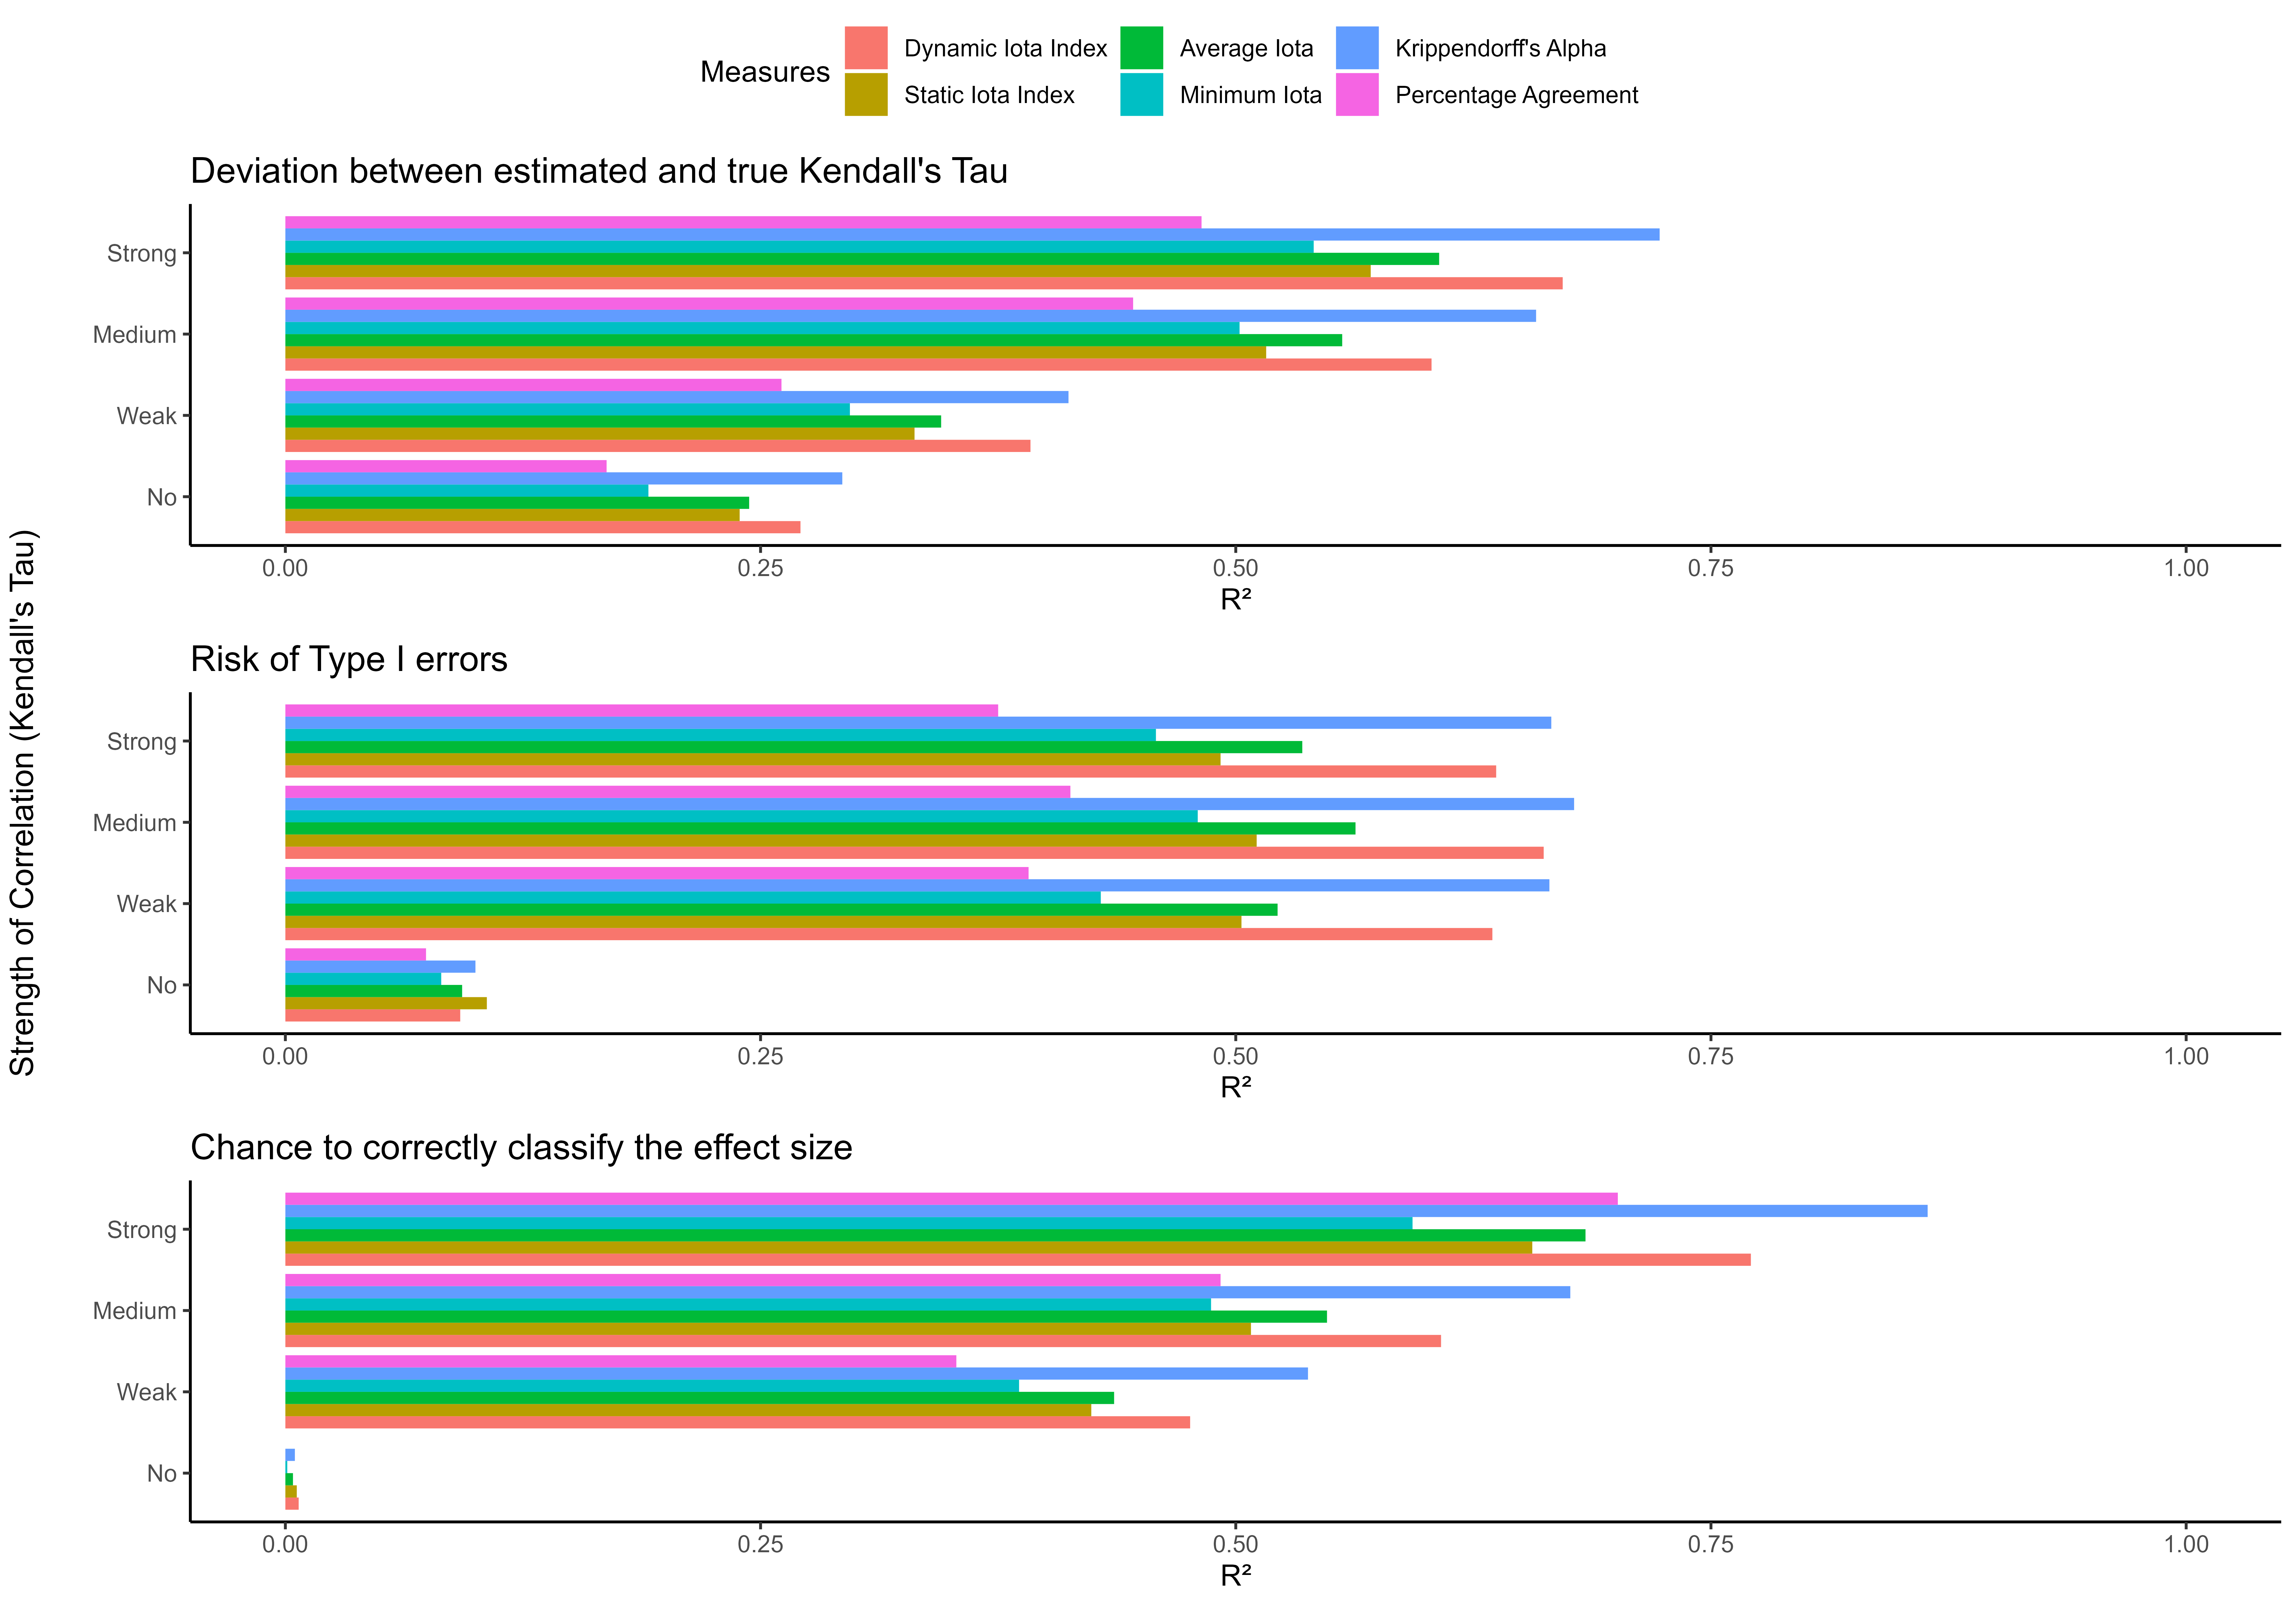
Studies investigated the power of the Iota Concept for predicting the quality of data generated by content analysis and compared the Iota measures with other existing measures of inter-coder reliability. The figure shows R² for both nominal and ordinal data.

For the case of nominal data, the Dynamic Iota Index performs similarly or even better to Krippendorff’s Alpha when predicting the deviation between the estimated sample association and the true sample association. Alike applies for estimating the risk of Type I errors and the chance for correctly classifying the effect size into categories proposed by Cohen (1988).

In the case of ordinal data, the Dynamic Iota Index shows a slightly inferior performance compared to Krippendorff’s Alpha, but the predictive power of both measures remains very high.
The Iota Concept provides cut-off values for several measures on the scale level. The following table reports the values that are currently recommended.
| measure | minimum | satisfactory | good | excellent |
|---|---|---|---|---|
| Dynamic Iota Index | 0.829 | 0.961 | 0.985 | 1* |
| Static Iota Index | 0.686 | 0.853 | 0.898 | 1* |
| Average Iota | 0.693 | 0.847 | 0.875 | 1* |
| Minimum Iota | 0.623 | 0.785 | 0.812 | 1* |
The minimal values imply the expectation that the estimated and true association/correlation do not deviate more than .3. Furthermore, these values justify the expectation that the risk of Type I errors is less than 10%.
The cut-off value for satisfactory justifies the expectation that the estimated and true association/correlation do not deviate more than .1 and that the risk of Type I errors is less than 5%.
The values for good imply that the estimated and true association/correlation do not deviate more than .3 with a certainty of 95%. Furthermore, these values guarantee that the risk of Type I errors is less than 10 % with a certainty of 95%.
Values of the category excellent ensure with a certainty of 95% that the risk of Type I errors is less than 5% and the deviation between estimated and true sample association/correlation exceeds not more than .1. Please note that this degree of certainty is not completely reached for all measures.
The presented cut-off values are only rules of thumb. They are
derived from the situations demanding the most reliability. More
situation-specific cut-off values can be calculated with the function
get_consequences(). Please refer to the vignette
“Calculating consequences and cut-off values”.
Florian Berding and Julia Pargmann (2022). Iota Reliability Concept of the Second Generation. Measures for Content Analysis Done by Humans or Artificial Intelligence. Berlin: Logos. https://doi.org/10.30819/5581
Florian Berding, Elisabeth Riebenbauer, Simone Stuetz, Heike Jahncke, Andreas Slopinski, and Karin Rebmann (2022). Performance and Configuration of Artificial Intelligence in Educational Settings. Introducing a New Reliability Concept Based on Content Analysis. Frontiers in Education. https://doi.org/10.3389/feduc.2022.818365
These binaries (installable software) and packages are in development.
They may not be fully stable and should be used with caution. We make no claims about them.
Health stats visible at Monitor.