The hardware and bandwidth for this mirror is donated by dogado GmbH, the Webhosting and Full Service-Cloud Provider. Check out our Wordpress Tutorial.
If you wish to report a bug, or if you are interested in having us mirror your free-software or open-source project, please feel free to contact us at mirror[@]dogado.de.
The intensitynet package provides tools to analyze point patterns in
space over planar network structures derived from graph-related
intensity measures for undirected, directed, and mixed networks. This
package is based on the research done by Eckardt, M., Mateu, J.
presented in the following papers:
Eckardt, M., Mateu, J.
Point Patterns Occurring on Complex Structures in Space and Space-Time:
An Alternative Network Approach. Journal of Computational and Graphical
Statistics 27. 312-322 (2017).
10.1080/10618600.2017.1391695
Eckardt, M., Mateu, J. Second-order and local characteristics
of network intensity functions. TEST 30, 318-340 (2021).
10.1007/s11749-020-00720-4
You can install the released version of intensitynet from CRAN with:
install.packages("intensitynet")And the development version from GitHub with:
# install.packages("devtools")
devtools::install_github("LlagosteraPol/intensitynet")This is an example that shows you how to set up intensitynet and calculate and plot the Geary-c correlation:
library(intensitynet)
library(spatstat)
#> Loading required package: spatstat.data
#> Loading required package: spatstat.geom
#> spatstat.geom 2.3-1
#> Loading required package: spatstat.core
#> Loading required package: nlme
#> Loading required package: rpart
#> spatstat.core 2.3-2
#> Loading required package: spatstat.linnet
#> spatstat.linnet 2.3-1
#>
#> spatstat 2.3-0 (nickname: 'That's not important right now')
#> For an introduction to spatstat, type 'beginner'
data(chicago)
chicago_df <- as.data.frame(chicago[["data"]]) # Get as dataframe the data from Chicago
# Get the adjacency matrix. One way is to create an igraph object from the edge coordinates.
edges <- cbind(chicago[["domain"]][["from"]], chicago[["domain"]][["to"]])
chicago_net <- igraph::graph_from_edgelist(edges)
# And then use the igraph function 'as_adjacency_matrix'
chicago_adj_mtx <- as.matrix(igraph::as_adjacency_matrix(chicago_net))
chicago_node_coords <- data.frame(xcoord = chicago[["domain"]][["vertices"]][["x"]],
ycoord = chicago[["domain"]][["vertices"]][["y"]])
# Create the intensitynet object, in this case will be undirected
intnet_chicago <- intensitynet(chicago_adj_mtx,
node_coords = chicago_node_coords,
event_data = chicago_df)
intnet_chicago <- RelateEventsToNetwork(intnet_chicago)
#> Calculating edge intensities...
#> ================================================================================
#> Calculating node intensities...
#> ================================================================================
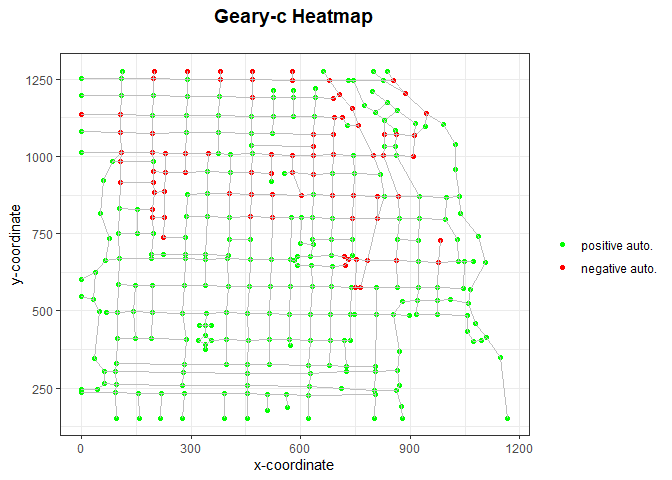
data_geary <- NodeLocalCorrelation(intnet_chicago, dep_type = 'geary', intensity = igraph::vertex_attr(intnet_chicago$graph)$intensity)
geary_c <- data_geary$correlation
intnet_chicago <- data_geary$intnet
PlotHeatmap(intnet_chicago, heattype='geary')
These binaries (installable software) and packages are in development.
They may not be fully stable and should be used with caution. We make no claims about them.
Health stats visible at Monitor.