The hardware and bandwidth for this mirror is donated by dogado GmbH, the Webhosting and Full Service-Cloud Provider. Check out our Wordpress Tutorial.
If you wish to report a bug, or if you are interested in having us mirror your free-software or open-source project, please feel free to contact us at mirror[@]dogado.de.
![]()
![]()
The {ino} R package provides a framework for analyzing
the role of initialization in numerical optimization. It allows for
systematic comparisons of different initialization strategies and
optimization algorithms using a unified R6 object called Nop.
You can install the released version from CRAN with:
install.packages("ino")The Ackley function has multiple local minima and one global minimum at the origin. We define
Nop
object,stats::nlm() and
stats::optim(), andlibrary("ino")
set.seed(1)
Nop_ackley <- Nop$new(f = TestFunctions::TF_ackley, npar = 2)$
set_optimizer(optimizeR::Optimizer$new("stats::nlm"))$
set_optimizer(optimizeR::Optimizer$new("stats::optim"))$
initialize_random(runs = 40)We can visualize the function surface along with the initial values:
library("ggplot2")
Nop_ackley |> autoplot()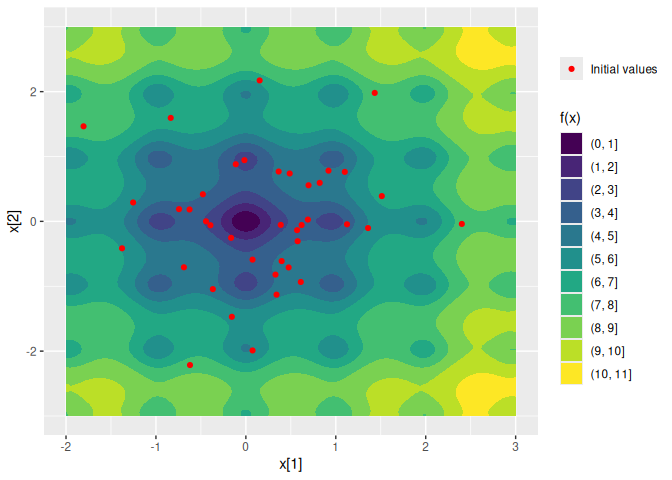
Next, we optimize the function via the previously defined initial values and optimizers:
Nop_ackley$optimize()In this example, stats::nlm() appears to be both
faster…
Nop_ackley$results |>
  ggplot2::autoplot("seconds", group_by = "optimizer", relative = TRUE) +
  ggplot2::scale_x_continuous(labels = scales::percent_format()) +
  ggplot2::labs(
    "x" = "optimization time relative to overall median",
    "y" = "optimizer"
  )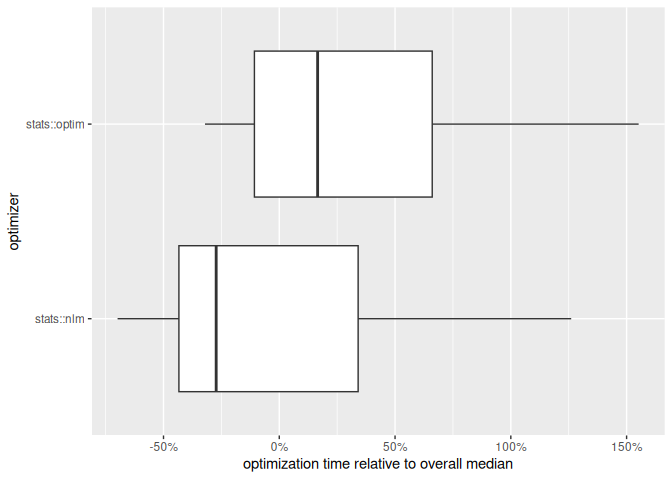
… and more effective at locating the global minimum:
Nop_ackley$optima(digits = 2, group_by = "optimizer")
#> $`stats::nlm`
#> # A tibble: 5 × 2
#>   value     n
#>   <dbl> <int>
#> 1  0       13
#> 2  2.58    13
#> 3  3.57    10
#> 4  5.38     3
#> 5  4.88     1
#>
#> $`stats::optim`
#> # A tibble: 5 × 2
#>   value     n
#>   <dbl> <int>
#> 1  2.58    17
#> 2  0       12
#> 3  3.57     5
#> 4  4.88     3
#> 5  5.38     3
#>
#> attr(,"class")
#> [1] "Nop_optima" "group_by"   "list"
Overall, (only) 25% of the initializations successfully converged to the global minimum.
Have a question, found a bug, request a feature, want to contribute? Please file an issue.
The {trackopt} package tracks parameter value, gradient, and Hessian at each iteration of numerical optimizers in R. This can be useful for analyzing optimization progress, diagnosing issues, and studying convergence behavior.
The {optimizeR} package provides a unified object-oriented framework for numerical optimizers in R. Allows for both minimization and maximization with any optimizer, optimization over more than one function argument, measuring of computation time, setting a time limit for long optimization tasks.
The {ao} package implements an iterative process that optimizes a function by alternately performing restricted optimization over parameter subsets. Instead of joint optimization, it breaks the optimization problem down into simpler sub-problems. This approach can make optimization feasible when joint optimization is too difficult.
These binaries (installable software) and packages are in development.
They may not be fully stable and should be used with caution. We make no claims about them.
Health stats visible at Monitor.