The hardware and bandwidth for this mirror is donated by dogado GmbH, the Webhosting and Full Service-Cloud Provider. Check out our Wordpress Tutorial.
If you wish to report a bug, or if you are interested in having us mirror your free-software or open-source project, please feel free to contact us at mirror[@]dogado.de.
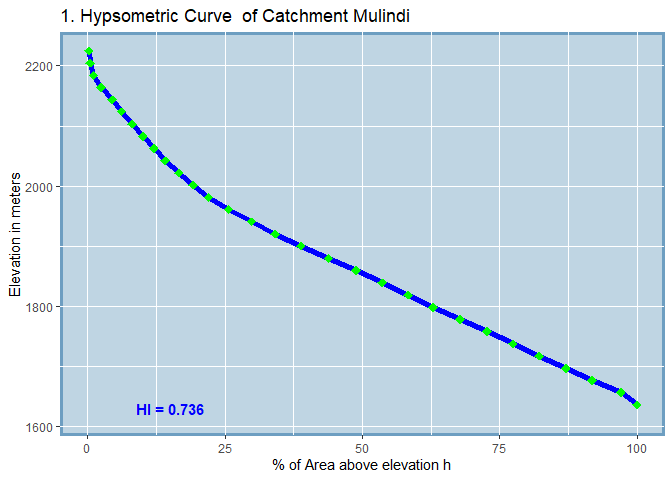
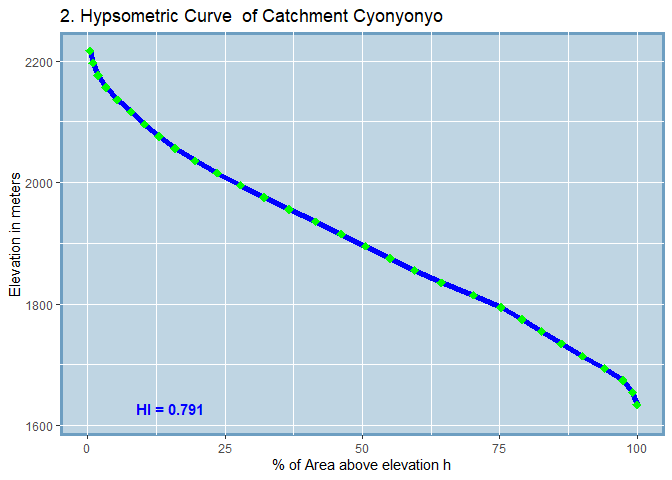
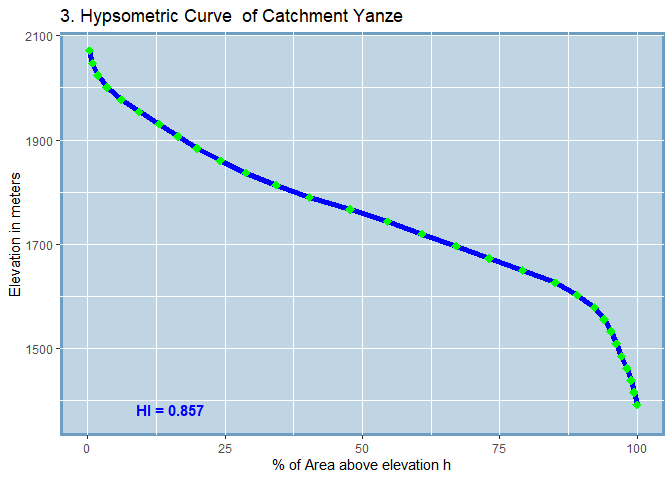
hypsoLoop has been developed as tool to automate the
drawing of hypsographic curves and the calculation of hypsometric curves
for a watershed that contains several sub-catchments.
You can install the development version of hypsoLoop
from GitHub
with:
# devtools::install_github("fgashakamba/hypsoLoop")and you can install the published beta version at CRAN with:
# Still in beta stage (version 0.2.0)
# Package currently under review by the CRAN team and it'll Soon be available at:
install.packages("hypsoLoop") hypsoLoopThe workhorse function of hypsoLoop is called
drawHypsocurves(). It accepts two arguments: a watersheds
boundary layer (an sf or sp object) and an
digital elevation model (DEM) covering the area of interest (a
rasterLayer object). Additionally, the user may specify
whether they want to get an output folder created in the root directory
or not. If not, the hypsometric curves are drawn in the viewer and a
summary table containing the hypsometric integers and other useful
information on the sub-catchments is returned.
library(hypsoLoop)
drawHypsoCurves(watersheds, DEM)
#>   SUB_CATCHMENT_CODE MIN_ELEV MAX_ELEV TOTAL_AREA H_INTEGRAL
#> 1            Mulindi     1616     2225    2576.38      0.736
#> 2          Cyonyonyo     1614     2217     3673.1      0.791
#> 3              Yanze     1368     2071    3435.65      0.857
Other two functions are exposed from this hypsoLoop.
These are the generateHypsoTables() which can be used to
generate area-elevation tables for the sub-catchments of a watersheds
and whose input requirements are the same as
drawHypsoCurves(). The calc_areas() function
is a handy function that be used to calculate the areas covered by each
class of a categorical raster. It accepts one input argument which has
to be a categorical raster of type rasterLayer and returns
a table that summarizes the areas (in Hectares) covered by each class or
category defined in the input raster.
library(hypsoLoop)
calc_areas(lulcYanze)
#>   CLASS         AREA
#> 1     1 1375.4506114
#> 2     2  528.6022953
#> 3     3 6830.5717454
#> 4     5   93.0439997
#> 5     6    0.2003449
#> 6    10  422.4313268
#> 7    11  401.4568430
These binaries (installable software) and packages are in development.
They may not be fully stable and should be used with caution. We make no claims about them.
Health stats visible at Monitor.