The hardware and bandwidth for this mirror is donated by dogado GmbH, the Webhosting and Full Service-Cloud Provider. Check out our Wordpress Tutorial.
If you wish to report a bug, or if you are interested in having us mirror your free-software or open-source project, please feel free to contact us at mirror[@]dogado.de.
This package aims to estimate Nonparametric Cumulative-Incidence Based Estimation of the Ratios of Sub-Hazard Ratios to Cause-Specific Hazard Ratios.
You can install the latest version of hrcomprisk in CRAN
or the development version from Github:
# Install hrcomprisk from CRAN
install.packages("hrcomprisk")
# Or the development version from GitHub:
# install.packages("devtools")
devtools::install_github("AntiportaD/hrcomprisk")hrcomprsk packageYou can use the dataset provided by the authors from the CKiD study, wich has the necessary variables to run the package.
library(hrcomprisk)
data <- hrcomprisk::dat_ckid
dim(data) #dimensions
#> [1] 626  13
names(data) #variable names
#>  [1] "b1nb0"        "event"        "male1fe0"     "incomelt30"   "incomegt75"
#>  [6] "lps"          "foodassist"   "public"       "matedultcoll" "privatemd"
#> [11] "entry"        "exit"         "inckd"
The package will create a data.frame object with the
cumulative incidence of each competing risk for each exposure group. We
can use the CRCumInc fuction.
mydat.CIF<-CRCumInc(df=data, time=exit, event=event, exposed=b1nb0, print.attr=T)
#> $names
#>  [1] "event"       "exposure"    "time"        "CIoinc_comp" "CIxinc_comp"
#>  [6] "CIoinc_1"    "CIxinc_1"    "CIoinc_2"    "CIxinc_2"    "R1"
#> [11] "R2"
#>
#> $class
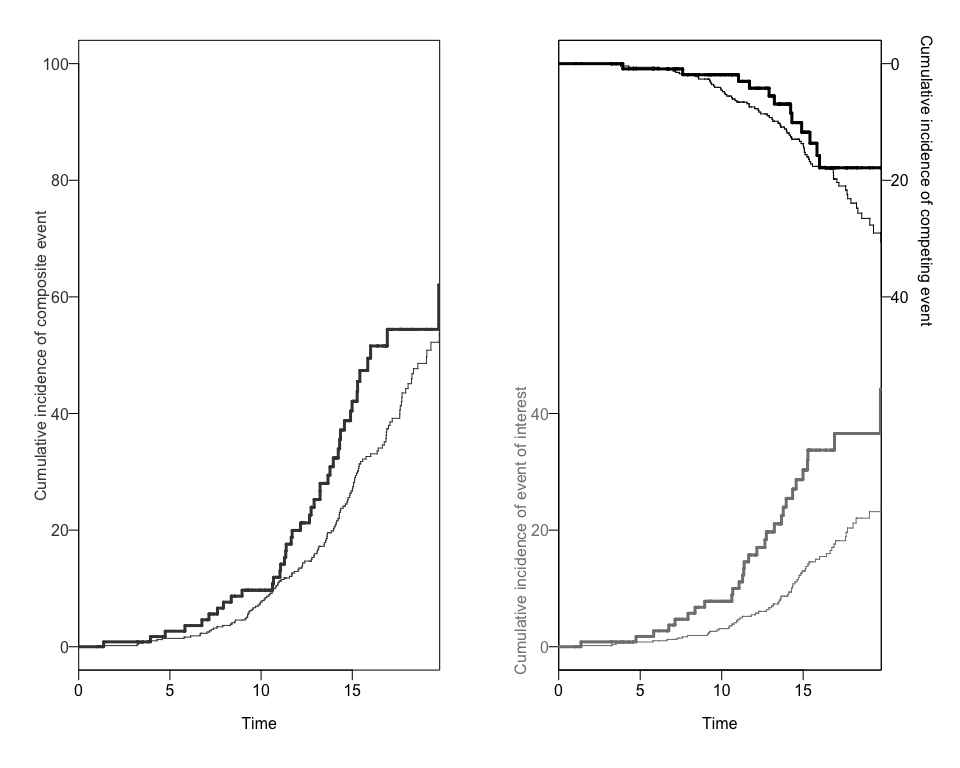
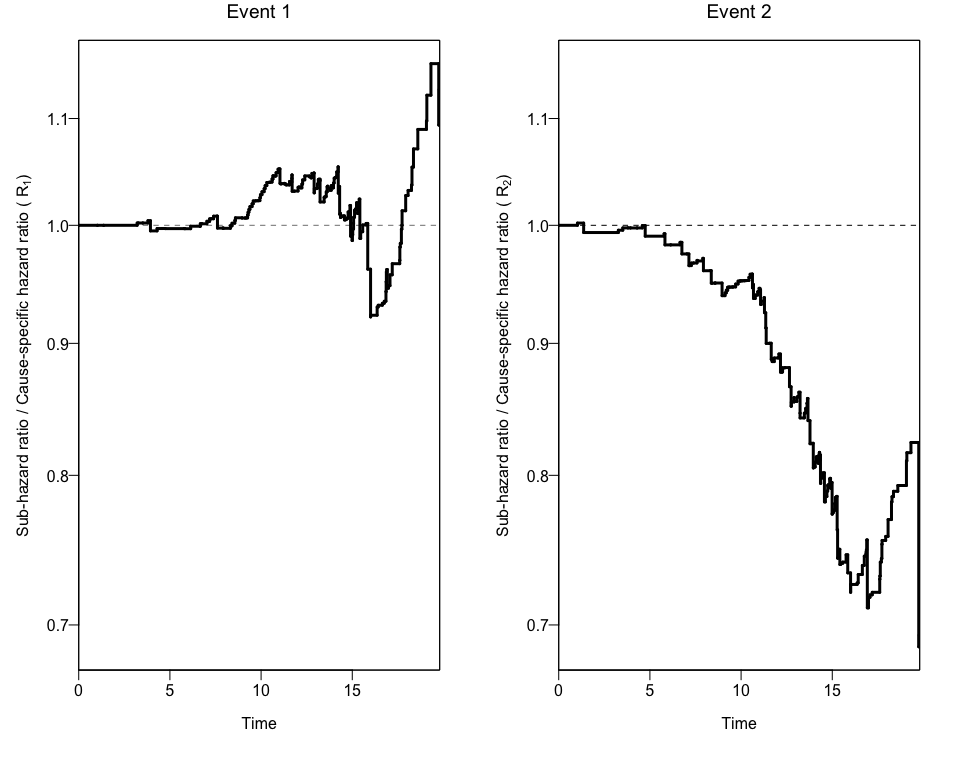
#> [1] "data.frame"We can also obtain two different plots using the plotCIF
function:
plots<-plotCIF(cifobj=mydat.CIF, maxtime = 20, eoi = 1)

In order to get confidence intervals to the ratio of Hazard Ratios
(Rk), we can use the bootCRCumInc function:
ciCIF<-bootCRCumInc(df=data, exit=exit, event=event, exposure=b1nb0, rep=100, print.attr=T)
#> $names
#> [1] "R1.lower" "R1.upper" "R2.lower" "R2.upper"
#>
#> $class
#> [1] "data.frame"
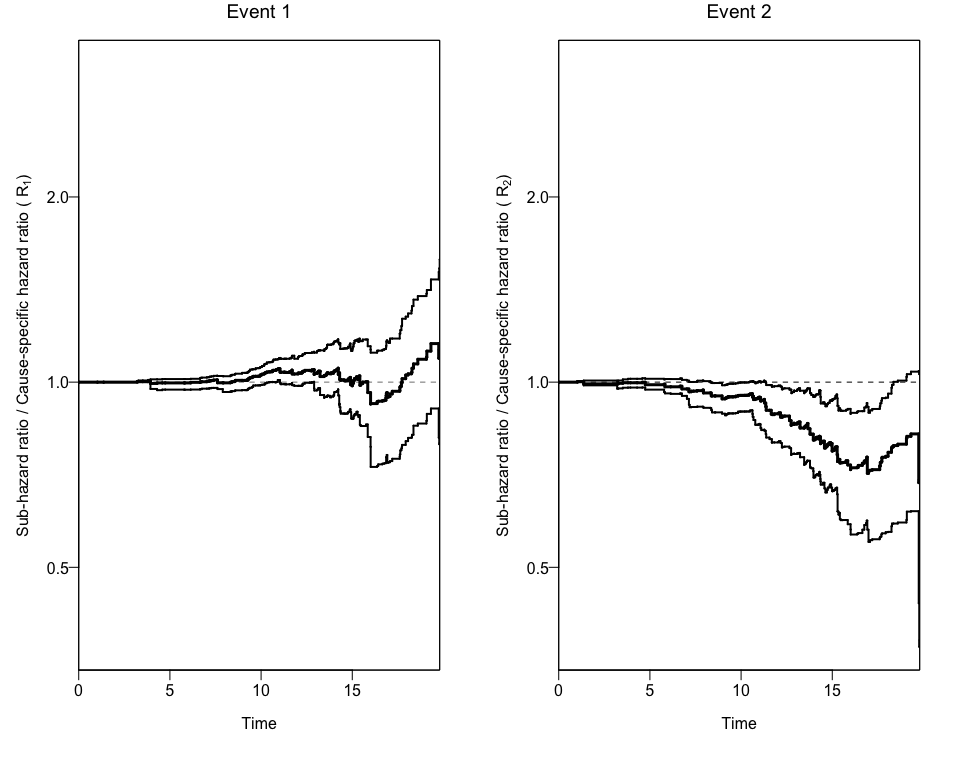
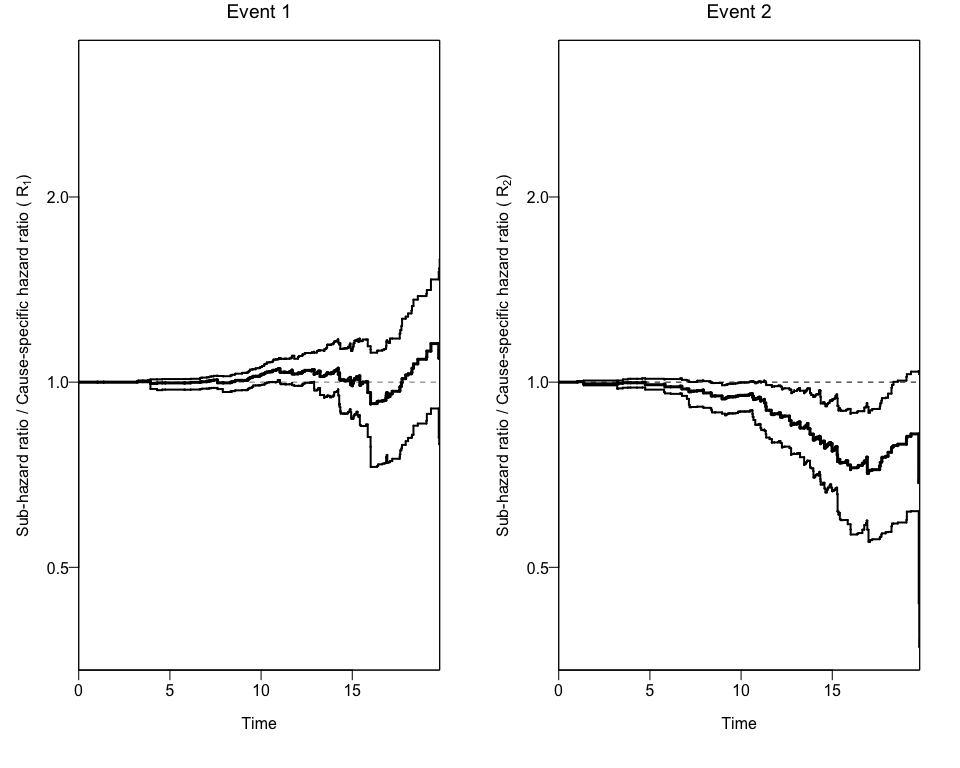
Finally, we can use this new data to add the 95% Confidence Intervals
to the previous plot using again the plotCIF function.
plotCIF(cifobj=mydat.CIF, maxtime= 20, ci=ciCIF)
npcrestThe package also offers a wrapper function (npcrest) to
do all these analyses in one step.
npcrest(df=data, exit=exit, event=event, exposure=b1nb0,rep=100, maxtime=20, print.attr=T)
#> $names
#>  [1] "event"       "exposure"    "time"        "CIoinc_comp" "CIxinc_comp"
#>  [6] "CIoinc_1"    "CIxinc_1"    "CIoinc_2"    "CIxinc_2"    "R1"
#> [11] "R2"
#>
#> $class
#> [1] "data.frame"
#>
#> $names
#> [1] "R1.lower" "R1.upper" "R2.lower" "R2.upper"
#>
#> $class
#> [1] "data.frame"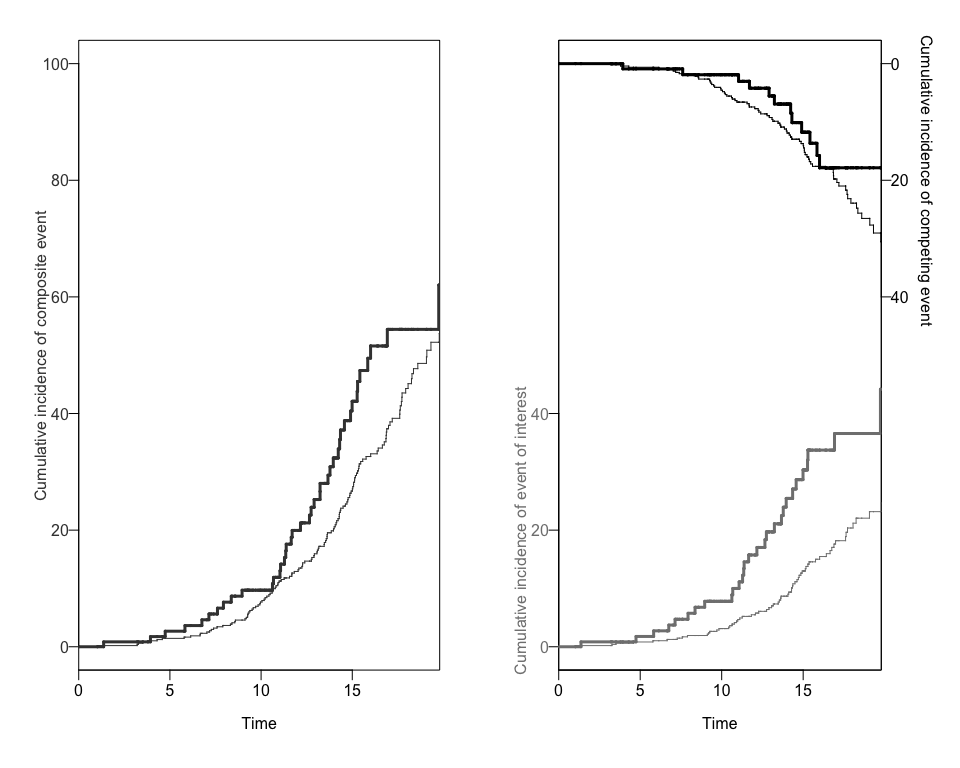
These binaries (installable software) and packages are in development.
They may not be fully stable and should be used with caution. We make no claims about them.
Health stats visible at Monitor.