The hardware and bandwidth for this mirror is donated by dogado GmbH, the Webhosting and Full Service-Cloud Provider. Check out our Wordpress Tutorial.
If you wish to report a bug, or if you are interested in having us mirror your free-software or open-source project, please feel free to contact us at mirror[@]dogado.de.
![]()
![]()
This package can be used to create a highlighted source document based on the frequency of phrases found in single or multiple note sheets. The goal of this method is to indicate the portions of the source document that individuals felt was most worth copying into notes, based on phrase frequency. The inputs necessary for this procedure are a notes document and a source document. The output will be HTML code for generating the highlighted text.
This work was funded (or partially funded) by the Center for Statistics and Applications in Forensic Evidence (CSAFE) through Cooperative Agreements 70NANB15H176 and 70NANB20H019 between NIST and Iowa State University, which includes activities carried out at Carnegie Mellon University, Duke University, University of California Irvine, University of Virginia, West Virginia University, University of Pennsylvania, Swarthmore College and University of Nebraska, Lincoln.
You can install from CRAN with:
install.packages("highlightr")You can install the development version of highlightr from GitHub with:
# install.packages("devtools")
devtools::install_github("rachelesrogers/highlightr")# load library
library(highlightr)
# connect collocation frequencies to source document
merged_frequency <- collocation_frequency(notepad_example, source_row=which(notepad_example$ID=="source"), text_column = "Text", fuzzy=TRUE,
n_bands=100)
# create `ggplot` object of the transcript
freq_plot <- collocation_plot(merged_frequency)
# add html tags to source document
page_highlight <- highlighted_text(freq_plot)page_highlightpage_highlight will produce HTML output that can then be
rendered into highlighted text. This can be done in R Markdown by
specifying the object outside of a code chunk as
`r page_highlight`, and knitting the document to HTML.
Alternatively, the xml2 package can be used to save the
output as an html file, as shown in the following code:
# load `xml2` library
library(xml2)
# save html output to desired location
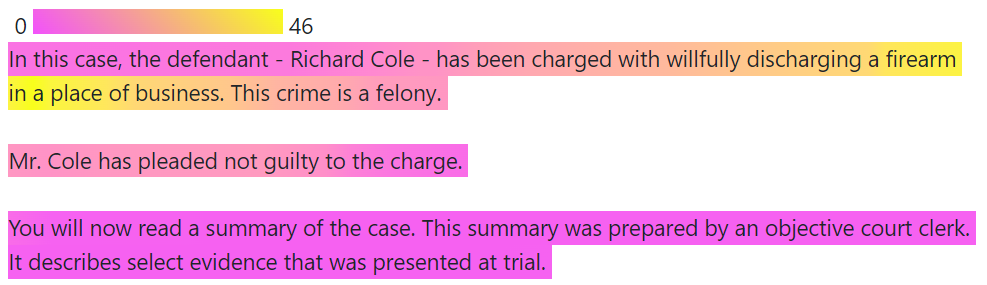
xml2::write_html(xml2::read_html(page_highlight), "filename.html")The below image is generated through the resulting html output (as
seen in the vignette("highlightr")).
These binaries (installable software) and packages are in development.
They may not be fully stable and should be used with caution. We make no claims about them.
Health stats visible at Monitor.