The hardware and bandwidth for this mirror is donated by dogado GmbH, the Webhosting and Full Service-Cloud Provider. Check out our Wordpress Tutorial.
If you wish to report a bug, or if you are interested in having us mirror your free-software or open-source project, please feel free to contact us at mirror[@]dogado.de.
![]()
![]()
![]()
You can install {gtreg} with the following code.
install.packages("gtreg")You can install the development version of {gtreg} from GitHub with:
# install.packages("devtools")
devtools::install_github("shannonpileggi/gtreg")The {gtreg} package creates tabular data summaries appropriate for regulatory submissions. The package builds the tables using {gtsummary}.
Here are slides and a recorded talk (17 min) from “Introducing {gtreg}: an R package to produce regulatory tables for clinical research” presented at the 2022 R in Medicine conference.

Summarize Raw Adverse Counts
tbl_ae_count() provides counts of all AEs, and omits
percentage statistics as multiple AEs can occur per subject.
library(gtreg)
tbl_ae_count <-
  df_adverse_events |>
  tbl_ae_count(
    ae = adverse_event,
    soc = system_organ_class,
    by = drug_attribution
  ) |>
  add_overall(across = "by") |>
  modify_spanning_header(all_ae_cols() ~ "**Drug Attribution**") |>
  bold_labels()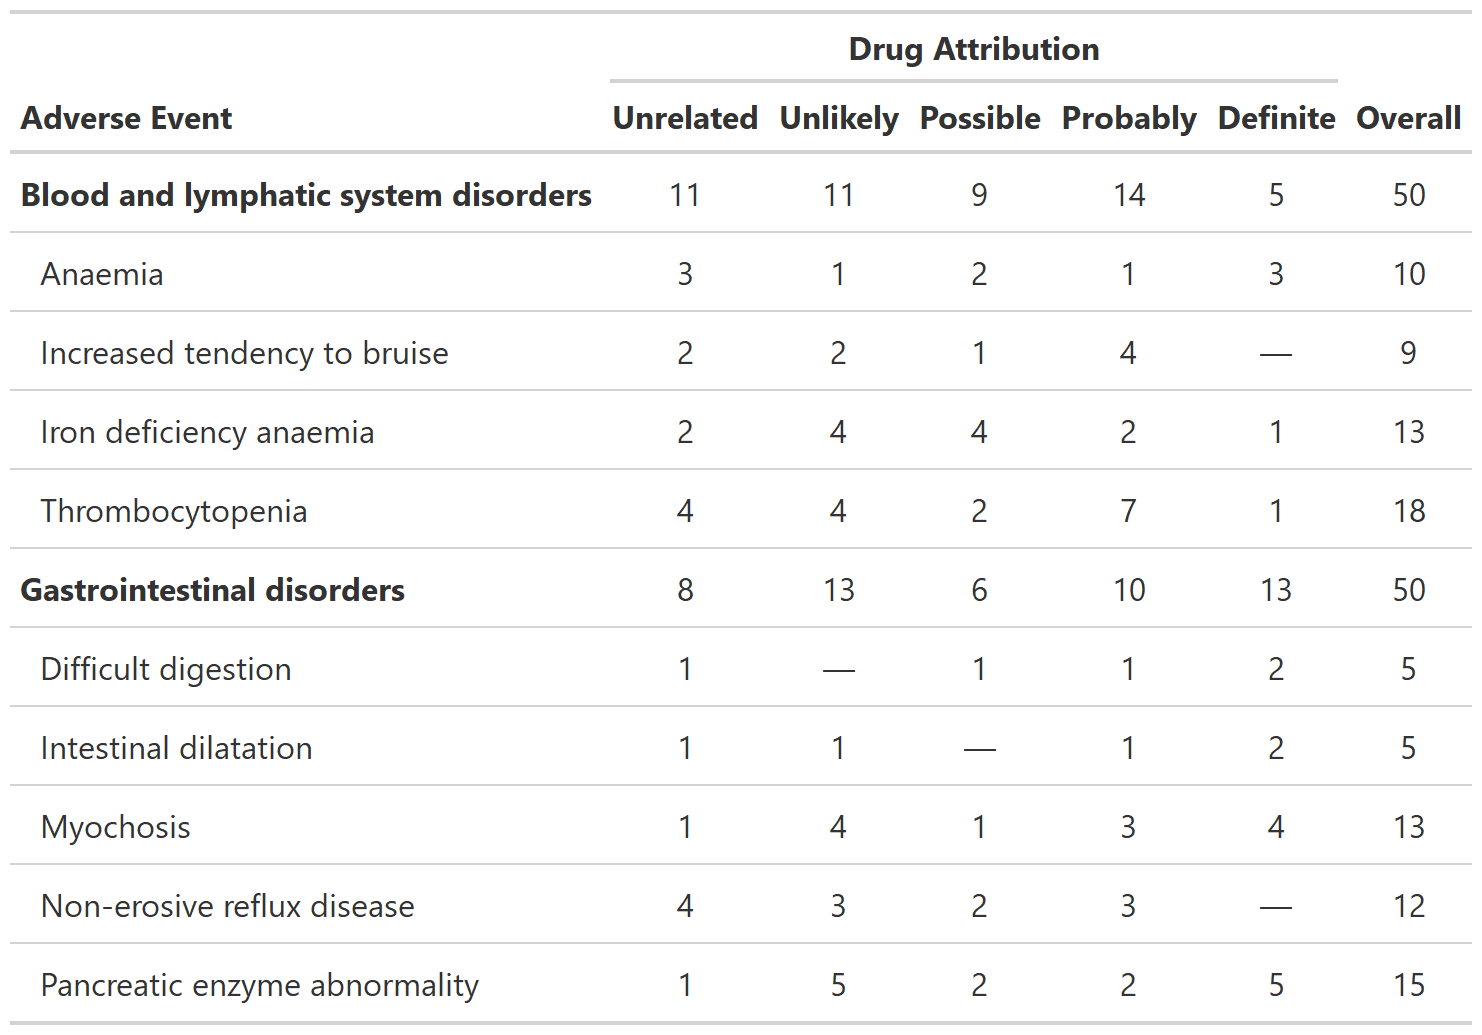
Summarize Adverse Events by Grade
tbl_ae() counts one AE per subject by maximum grade;
percentage statistics are provided by default with the denominators
reflecting the number of patients in the study.
library(gtreg)
gtsummary::theme_gtsummary_compact()
#> Setting theme "Compact"

tbl_ae <-
  df_adverse_events |>
  tbl_ae(
    id_df = df_patient_characteristics,
    id = patient_id,
    ae = adverse_event,
    soc = system_organ_class,
    by = grade,
    strata = trt
  ) |>
  modify_header(all_ae_cols() ~ "**Grade {by}**") |>
  bold_labels()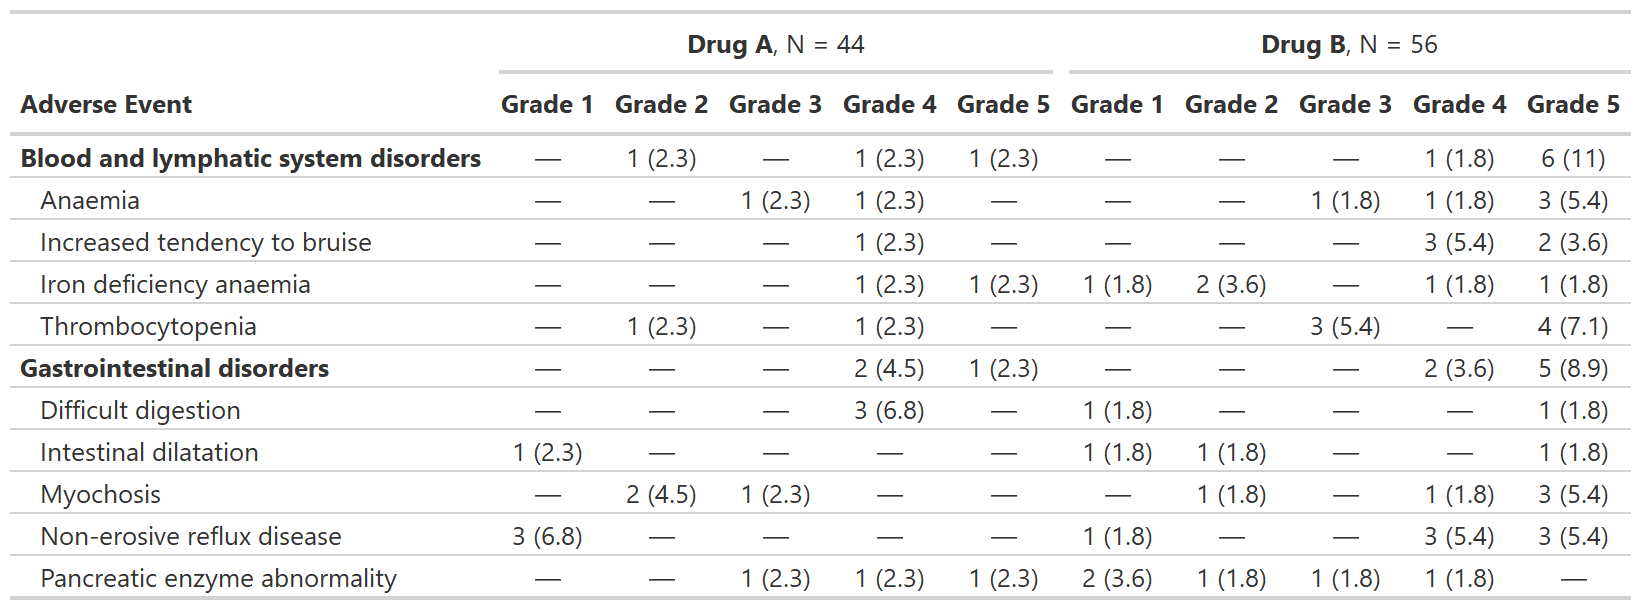
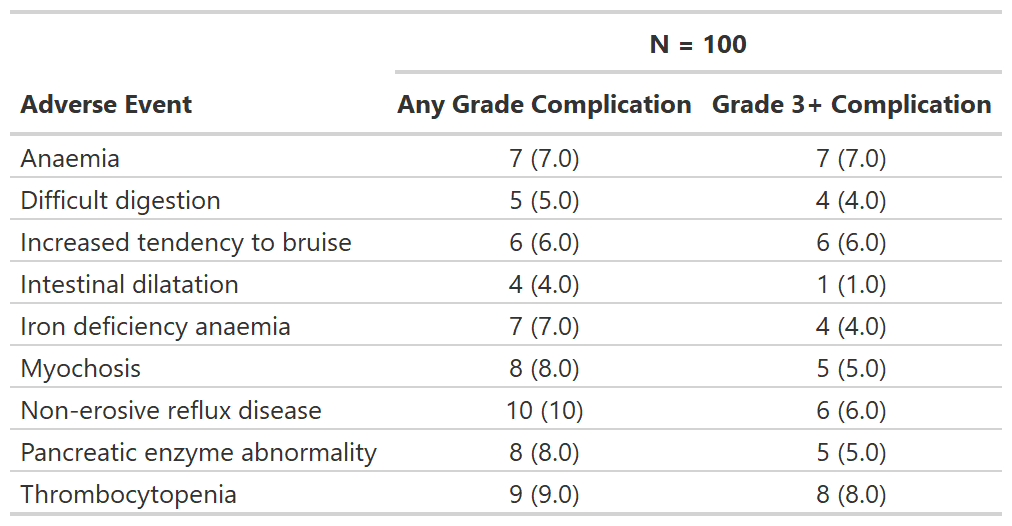
Focus on rates of high grade complications
tbl_ae_focus() also counts one AE per subject by maximum
grade, and is a convenience to summarize dichotomous AE attributes.
tbl_ae_focus <-
  df_adverse_events |>
  tbl_ae_focus(
    id_df = df_patient_characteristics,
    id = patient_id,
    ae = adverse_event,
    include = c(any_complication, grade3_complication)
  )
Regulatory summary
tbl_reg_summary() creates a data summary table often
seen in regulatory submissions.
tbl_reg_summary <-
  df_patient_characteristics |>
tbl_reg_summary(by = trt, include = c(marker, status)) 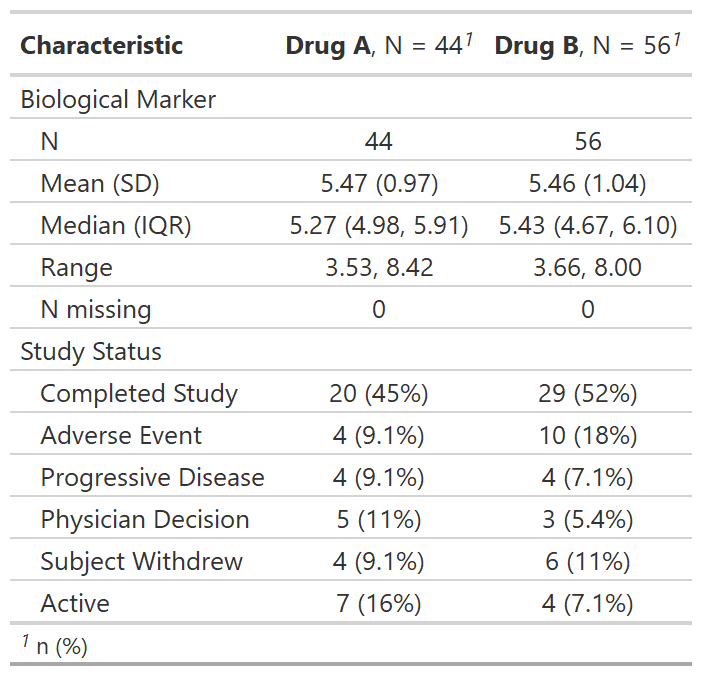
Print an AE listing
tbl_listing() creates a gtsummary-class listing of data
to enable grouped printing.
tbl_listing <-
  head(df_adverse_events, n = 10) |>
  select(system_organ_class, adverse_event, grade, drug_attribution, patient_id) |>
  dplyr::arrange(adverse_event, desc(grade)) |>
  tbl_listing(group_by = system_organ_class) |>
  bold_labels()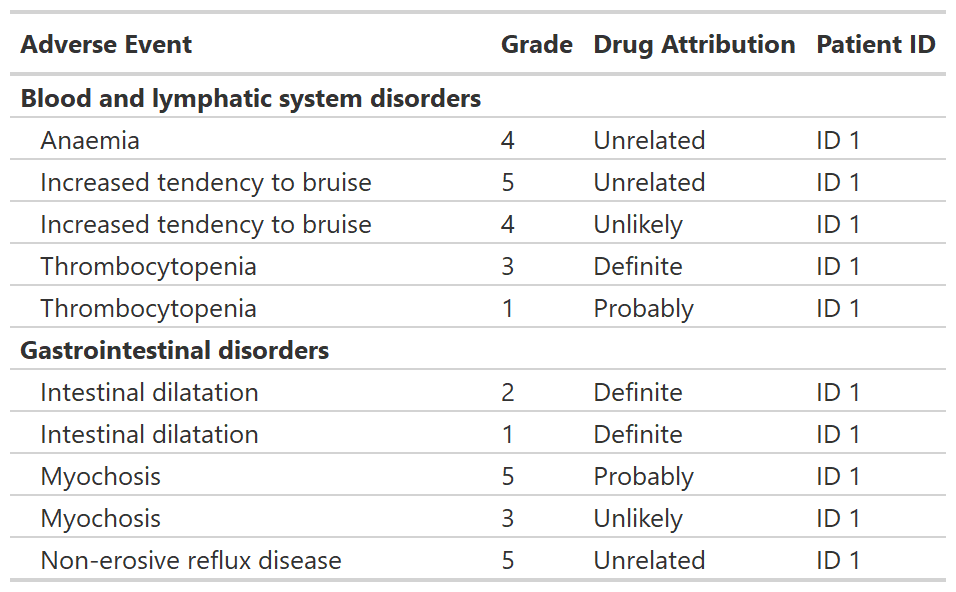
Please note that the gtreg project is released with a Contributor Code of Conduct. By contributing to this project, you agree to abide by its terms.
These binaries (installable software) and packages are in development.
They may not be fully stable and should be used with caution. We make no claims about them.
Health stats visible at Monitor.