

The hardware and bandwidth for this mirror is donated by dogado GmbH, the Webhosting and Full Service-Cloud Provider. Check out our Wordpress Tutorial.
If you wish to report a bug, or if you are interested in having us mirror your free-software or open-source project, please feel free to contact us at mirror[@]dogado.de.
LaTeX math and markdown for R graphics: grid, base plots and ggplot2. No LaTeX installation needed. Built on the MicroTeX layout engine.
Everything on KaTeX’s list
of supported functions is drawn, and more: amsmath and mathtools
environments, equation numbers, tables from kable() and gt,
tikz-cd diagrams, \ce{} chemistry, and a
subset of siunitx.
install.packages("gridmicrotex")

# Development version
# install.packages("devtools")
devtools::install_github("adayim/gridmicrotex")library(gridmicrotex)
library(grid)
grid.newpage()
grid.latex(r"($x = \frac{\textcolor{red}{-b} \pm \sqrt{b^2 - 4ac}}{2a}$)",
gp = gpar(fontsize = 30))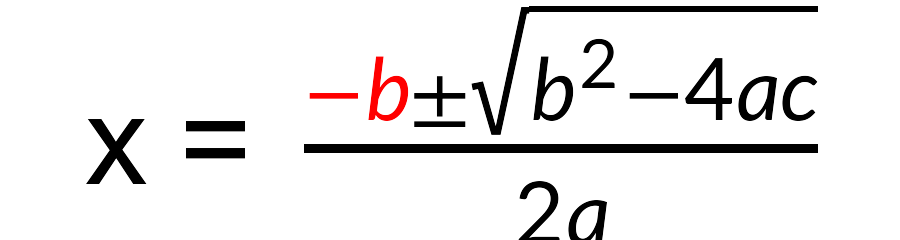
Text and math mix as in LaTeX, with math between $...$.
Use input_mode = "math" for a bare formula, or
input_mode = "document" for paragraphs, headings and
displayed equations. latex_grob() returns the grob instead
of drawing it.
latex_options(device_math = TRUE)

plot(1:10, (1:10)^2,
     main = r"(Slope $\hat{\beta}_1 = \sum_{i=1}^{n} x_i^2$)",
     xlab = "Cost $5-$10 per unit",   # no math, drawn as written
     ylab = r"($\frac{y}{2}$)")
text(3, 80, r"($\int_0^\infty e^{-x^2}\,dx$)", col = "steelblue")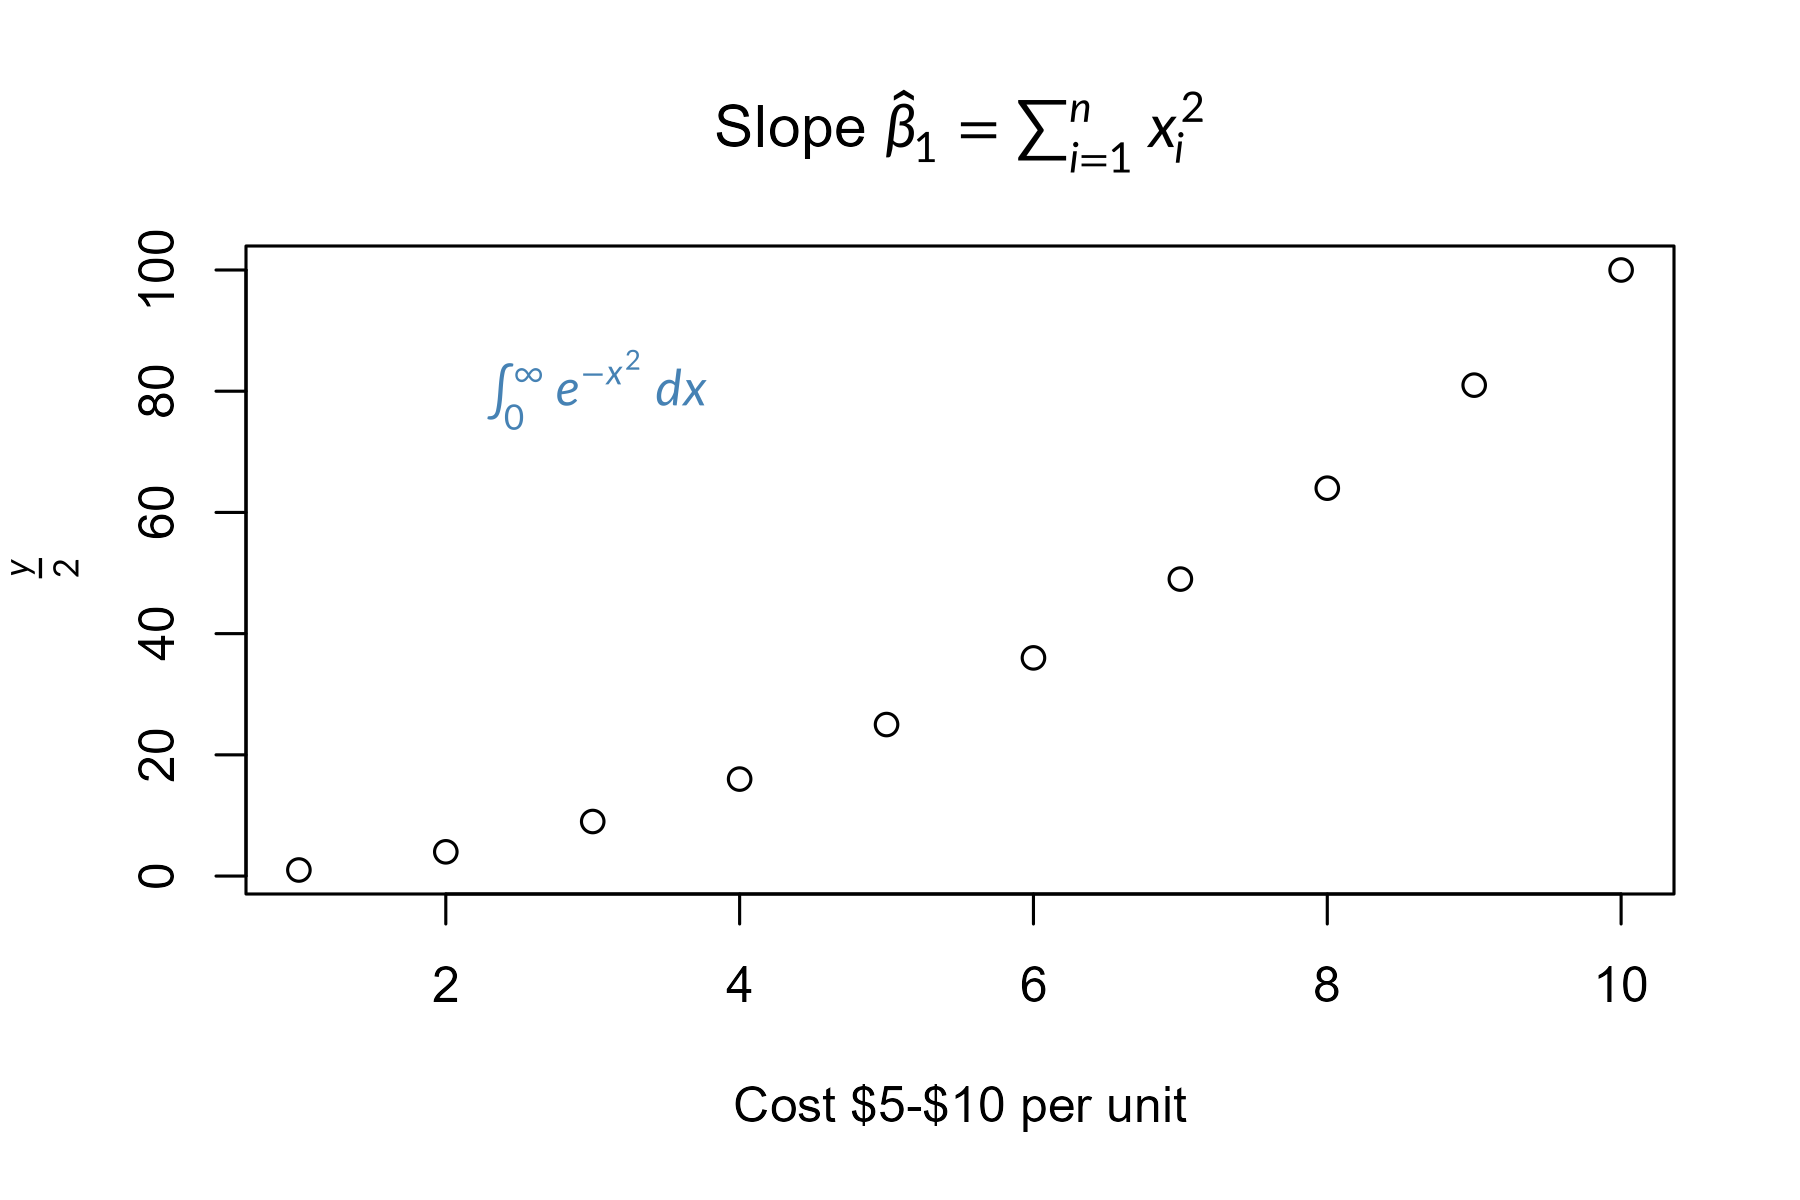
With device_math = TRUE, any label containing math is
typeset: titles, axis labels, text(),
legend(), and labels in lattice and ggplot2 plots too.
library(ggplot2)

tab <- r"(\begin{tabular}{c|c} A & $B^2$ \\ \hline 1 & \cellcolor{#00bde5}2 \\ 3 & 4 \end{tabular})"
df <- data.frame(x = 1:3, y = 1:3,
                 eq = c("$x^2$", r"($\frac{a}{b}$)", r"($\sum_{i=1}^n x_i$)"))

ggplot(df, aes(x, y, label = eq)) +
  geom_latex() +
  annotate("latex", x = 1.15, y = 2.7, label = tab, size = 12) +
  labs(x = r"($\beta_1 \cdot x + \beta_0$)") +
  theme(axis.title.x = element_latex())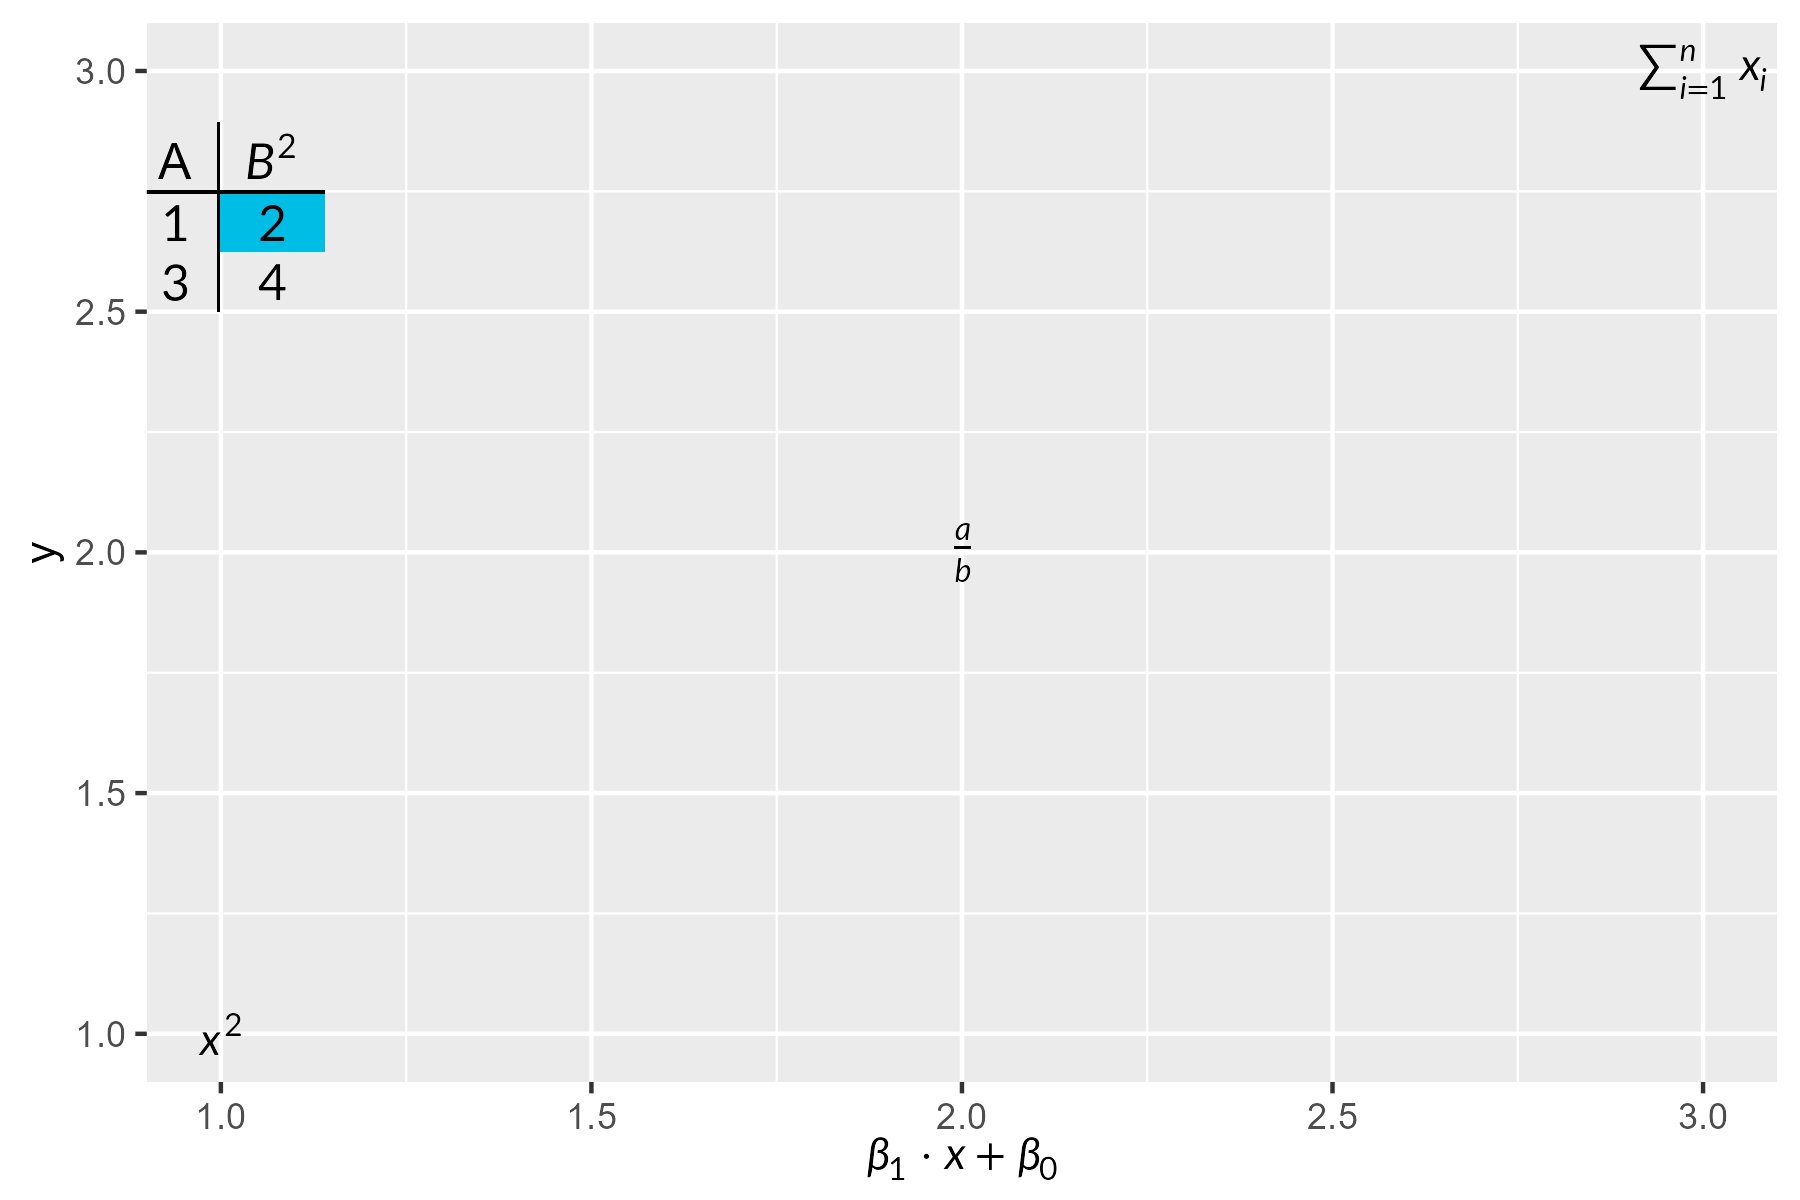
grid.newpage()
grid.markdown(r"(The **fitted** slope is $\hat{\beta}_1 = 0.42$ (*p* < 0.001).)",
              x = 0.02, hjust = 0, gp = gpar(fontsize = 20))
markdown_box_grob() lays out whole documents: headings,
lists, code, tables and images. geom_markdown() and
element_markdown() bring markdown labels to ggplot2.
Lete Sans Math (the default) and STIX Two Math
(math_font = "stix") are included. load_font()
names a font file or an installed family, to use in gp, in
latex_options() and in the LaTeX itself
(\setmainfont, \fontspec, …); text in it is
drawn from the file on every device.
If the default device on Windows or macOS warns
font family not found, use ragg, svglite or
cairo_pdf() (in knitr:
knitr::opts_chunk$set(dev = "ragg_png")), or set
render_mode = "path" to draw glyphs as outlines.
| Approach | LaTeX required? | Device independent? | Math coverage | Markdown |
|---|---|---|---|---|
tikzDevice |
Yes | No | Full | No |
xdvir |
Yes | No | Full | No |
latexpdf |
Yes | No | Full (tables) | No |
latex2exp |
No | Yes | Limited | No |
plotmath |
No | Yes | Limited | No |
gridtext |
No | Yes | None | Yes |
marquee |
No | Yes | None | Yes |
| gridmicrotex | No | Yes | Broad | Yes |
A note on development: This package was developed as a proof of concept for AI-assisted package creation. I designed the architecture and specification, and the core C++ integration (via MicroTeX) was largely facilitated by AI, with my review and oversight of the design and final outputs. I am sharing it because it works, and I hope that others will find it useful. Contributions, bug reports and improvements from the community are very welcome.
These binaries (installable software) and packages are in development.
They may not be fully stable and should be used with caution. We make no claims about them.
Health stats visible at Monitor.