The hardware and bandwidth for this mirror is donated by dogado GmbH, the Webhosting and Full Service-Cloud Provider. Check out our Wordpress Tutorial.
If you wish to report a bug, or if you are interested in having us mirror your free-software or open-source project, please feel free to contact us at mirror[@]dogado.de.

![]()
![]()
![]()
Interactive 3D brain atlas visualization in R. Plot brain parcellations as WebGL meshes powered by Three.js, or render publication-quality static images through rgl and rayshader. A pipe-friendly API lets you map data onto brain regions, control camera angles, toggle region edges, overlay glass brains, and snapshot the result.
Install from CRAN:
install.packages("ggseg3d")Or get the development version from the ggsegverse r-universe:
options(
  repos = c(
    ggsegverse = "https://ggsegverse.r-universe.dev",
    CRAN = "https://cloud.r-project.org"
  )
)
install.packages("ggseg3d")Three atlases ship with the package (via ggseg.formats):
dk – Desikan-Killiany cortical atlasaseg – Automatic subcortical segmentationtracula – White-matter tract atlasAdditional atlases are available through the ggsegverse r-universe.
ggseg3d(atlas = dk(), hemisphere = "left") |>
  pan_camera("left lateral")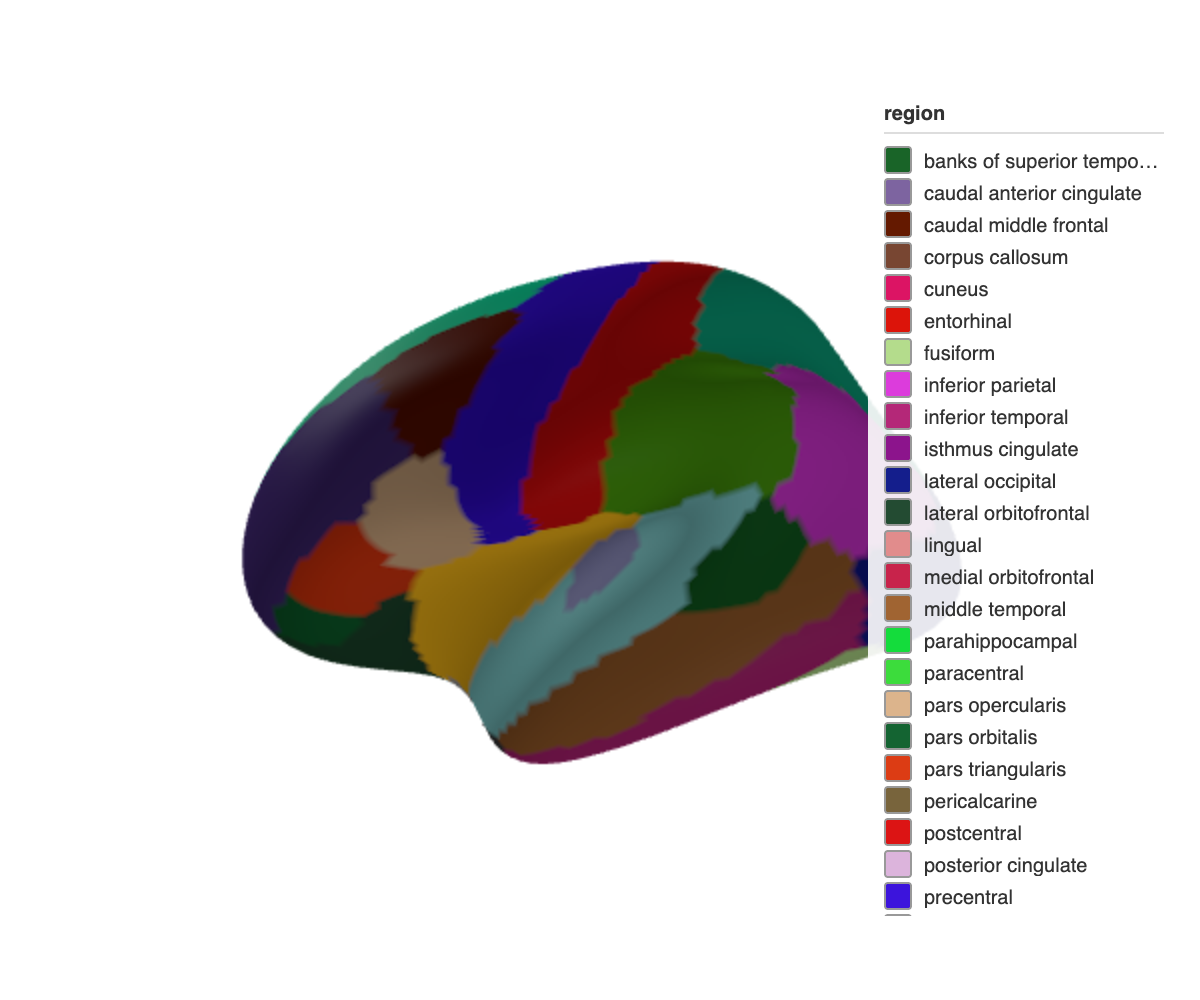
Subcortical structures with a translucent glass brain overlay:
ggseg3d(atlas = aseg()) |>
  add_glassbrain() |>
  pan_camera("right lateral")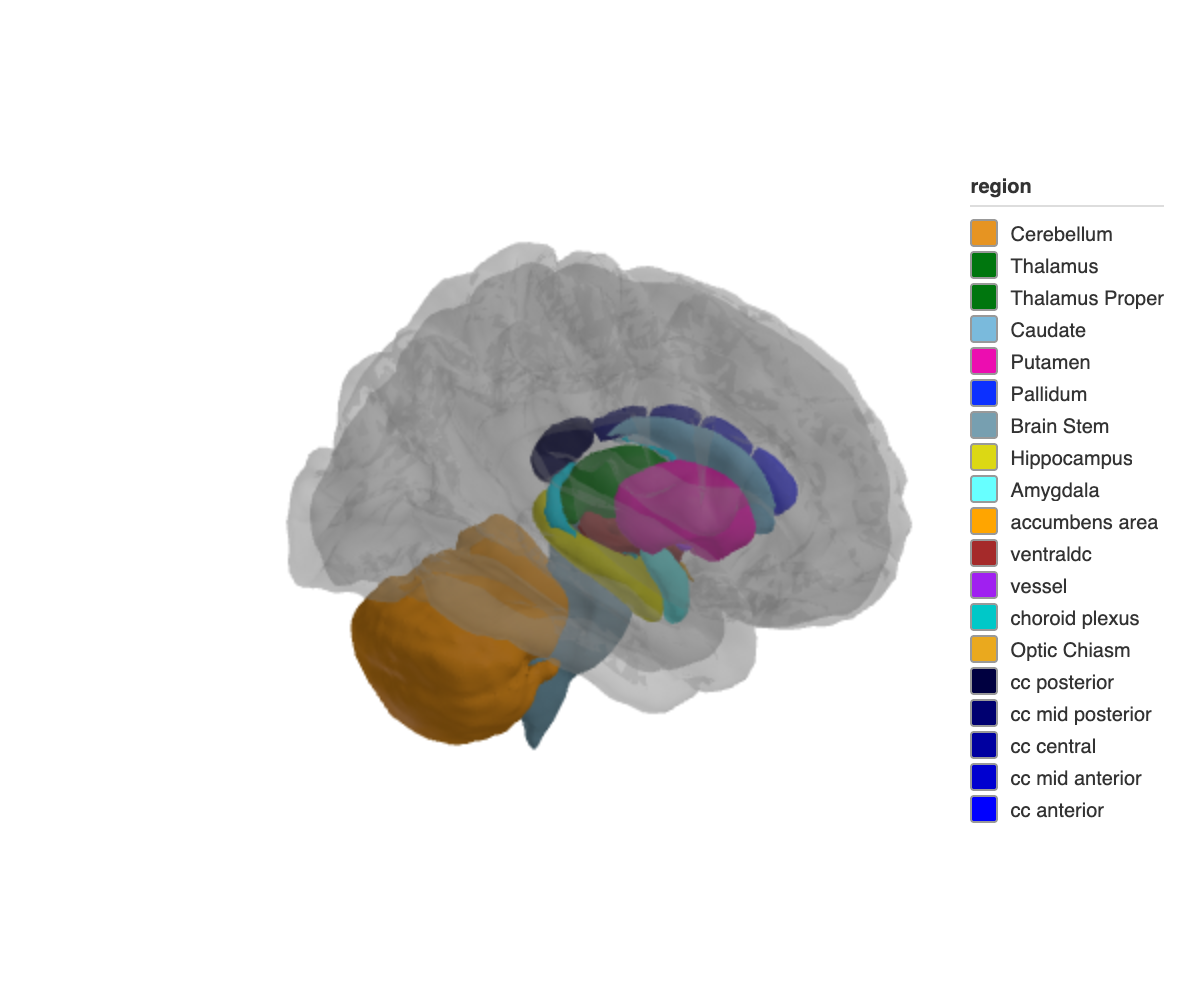
See the package website for the full walkthrough, rayshader rendering, and Shiny integration.
Mowinckel & Vidal-Piñeiro (2020). Visualization of Brain Statistics With R Packages ggseg and ggseg3d. Advances in Methods and Practices in Psychological Science. doi:10.1177/2515245920928009
This tool is partly funded by:
EU Horizon 2020 Grant: Healthy minds 0-100 years: Optimising the use of European brain imaging cohorts (Lifebrain).
Grant agreement number: 732592.
Call: Societal challenges: Health, demographic change and well-being
These binaries (installable software) and packages are in development.
They may not be fully stable and should be used with caution. We make no claims about them.
Health stats visible at Monitor.