The hardware and bandwidth for this mirror is donated by dogado GmbH, the Webhosting and Full Service-Cloud Provider. Check out our Wordpress Tutorial.
If you wish to report a bug, or if you are interested in having us mirror your free-software or open-source project, please feel free to contact us at mirror[@]dogado.de.
The objective of ggscribe is to provide annotation helper functions for publication-quality ‘ggplot2’ visualisation.
Note:
axis_* functions placed outside the panel require
clip = "off" in the coord space.Install from CRAN, or the development version from GitHub.
install.packages("ggscribe")
pak::pak("davidhodge931/ggscribe")ggscribe provides various axis and panel annotation helper functions.
library(ggplot2)
library(dplyr)

set_theme(
  ggrefine::theme_light(
      panel_heights = rep(unit(50, "mm"), 100),
      panel_widths = rep(unit(75, "mm"), 100),
  )
)

mtcars |>
  ggplot(aes(x = wt, y = mpg, colour = as.factor(gear), fill = as.factor(gear))) +
  scale_fill_discrete(palette = jumble::jumble) +
  scale_colour_discrete(palette = blends::multiply(jumble::jumble)) +
  #clip = "off" is required for axis_text, axis_ticks and axis_bracket
  coord_cartesian(clip = "off") +
  #reference lines and background
  ggscribe::reference_line(xintercept = 2.4) +
  ggscribe::reference_line(yintercept = 12)  +
  ggscribe::panel_shade(
    xmin = 4,
    xmax = 5,
  ) +
  #top axis
  scale_x_continuous(
    sec.axis = ggscribe::sec_axis_text(
      breaks = c(mean(c(4, 5))),
      labels = c("Range"),
      guide = ggscribe::guide_sec_axis_text(
        angle = 90,
      )
    )
  ) +
  ggscribe::axis_bracket(
    yintercept = I(1),
    breaks = c(4, 5),
  ) +
  ggscribe::axis_text(
    yintercept = I(1),
    breaks = c(2.4),
    labels = c("Threshold"),
  ) +
  #right axis
  ggscribe::axis_text(
    xintercept = I(1),
    breaks = 12,
    labels = "Threshold",
  ) +
  #bottom axis
  ggscribe::axis_ticks(
    yintercept = I(0),
    breaks = 3.8,
    length = rel(-4.5),
  ) +
  ggscribe::axis_text(
    yintercept = I(0),
    breaks = 3.8,
    labels = "Threshold",
    length = rel(-4.5),
  ) +
  labs(x = "\nWeight") +
  #geom
  geom_point() +
  #annotations fit plot
  theme(plot.background = element_rect(colour = "grey92"))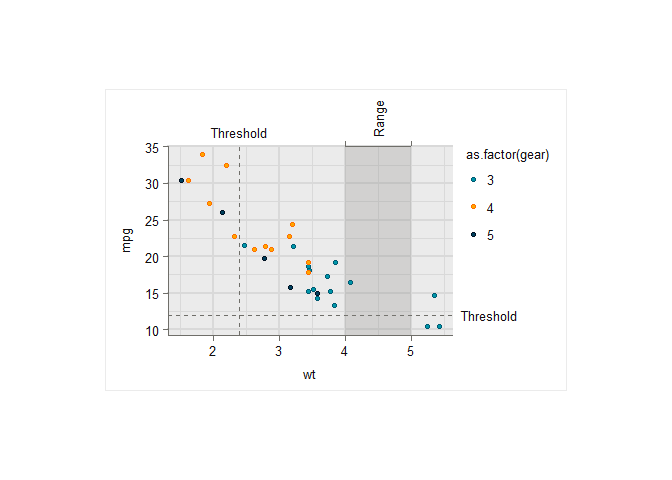
And a function to ensure text is easily coloured for contrast on a fill aesthetic.
ggwidth::set_equiwidth(equiwidth = 1.75)

mtcars |>
  count(cyl, am) |>
  mutate(
    am = if_else(am == 0, "Automatic", "Manual"),
    cyl = as.factor(cyl)
  ) |>
  ggplot(aes(x = am, y = n, colour = cyl, fill = cyl, label = n)) +
  geom_col(
    position = position_dodge2(preserve = "single", padding = 0.05),
    width = ggwidth::get_width(n = 2, n_dodge = 3),
  ) +
  scale_fill_discrete(palette = jumble::jumble) +
  scale_colour_discrete(palette = blends::multiply(jumble::jumble)) +
  geom_text(
    mapping = ggscribe::aes_contrast(), # or aes(!!!ggscribe::aes_contrast()),
    position = position_dodge2(
      width = ggwidth::get_width(n = 2, n_dodge = 3),
      padding = 0.05,
      preserve = "single"),
    vjust = 1.33,
    show.legend = FALSE,
  ) +
  scale_y_continuous(expand = expansion(c(0, 0.05))) +
  theme(panel.grid.major.x = element_blank()) +
  theme(axis.line.y = element_blank()) +
  theme(axis.ticks.y = element_blank())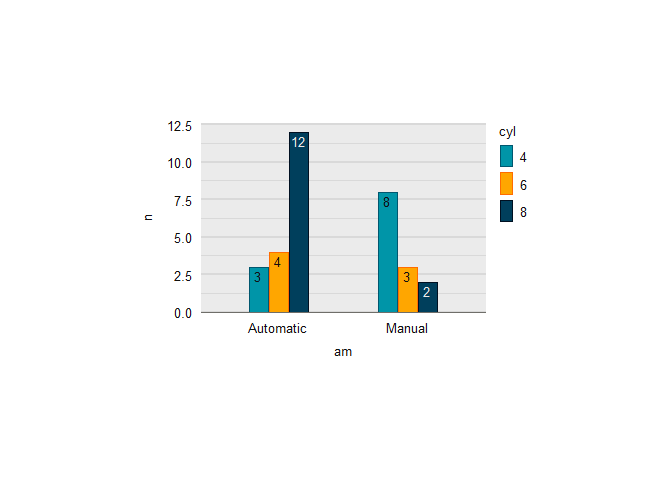
This package is part of a group of related packages built to extend ggplot2.
|
|
|
|
|
|
|
These binaries (installable software) and packages are in development.
They may not be fully stable and should be used with caution. We make no claims about them.
Health stats visible at Monitor.