
The hardware and bandwidth for this mirror is donated by dogado GmbH, the Webhosting and Full Service-Cloud Provider. Check out our Wordpress Tutorial.
If you wish to report a bug, or if you are interested in having us mirror your free-software or open-source project, please feel free to contact us at mirror[@]dogado.de.
The objective of ggrefine is to provide complete themes and functions for publication-quality ‘ggplot2’ visualisation.
Install from CRAN, or development version from GitHub.
install.packages("ggrefine")
pak::pak("davidhodge931/ggrefine")The themes are built to work with the refine functions in that they have all axis and panel grid elements.
They can also be customised easily.
The theme_ggplot2 function has a smart
panel_grid_colour default that is derived from the
panel_background_fill.
library(ggplot2)
library(ggrefine)

set_lights()
update_panel_size(heights = unit(5, "cm"), widths = unit(7.5, "cm"))

p <- mpg |>
  ggplot() +
  aes(x = hwy) +
  geom_histogram() +
  scale_y_zero() +
  scale_colour_blend_discrete() +
  refine_axis_grid()

p + labs(title = "theme_lights")
#> `stat_bin()` using `bins = 30`. Pick better value `binwidth`.
update_greys()
p + labs(title = "theme_greys")
#> `stat_bin()` using `bins = 30`. Pick better value `binwidth`.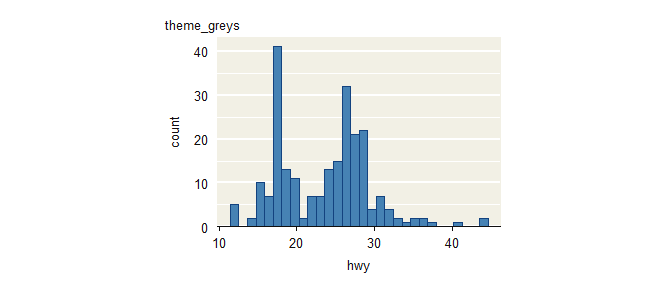
update_darks()
p + labs(title = "theme_darks")
#> `stat_bin()` using `bins = 30`. Pick better value `binwidth`.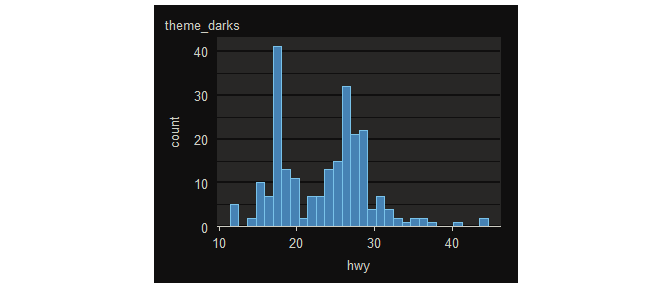
update_lights()The package provides dynamic colour and fill aesthetic and scale helpers that evaluate aesthetics late to provide automatic colour or fill properties.
These can be:
Note aes_colour_contrast requires the
ggrefine function to be used instead of
ggplot2::ggplot to work where no fill aesthetic is mapped.
As such, it can be useful to always use ggrefine followed by
ggplot2::aes to avoid thinking about this.
penguins |>
  ggrefine() +
  aes(x = flipper_len, y = body_mass, fill = I(jumble::pink)) +
  geom_point() +
  scale_colour_blend_discrete() +
  refine_axis_grid()
#> Warning: Removed 2 rows containing missing values or values outside the scale range
#> (`geom_point()`).
penguins |>
  ggrefine() +
  aes(x = flipper_len, y = body_mass, fill = species) +
  geom_point() +
  scale_colour_blend_discrete() +
  refine_axis_grid()
#> Warning: Removed 2 rows containing missing values or values outside the scale range
#> (`geom_point()`).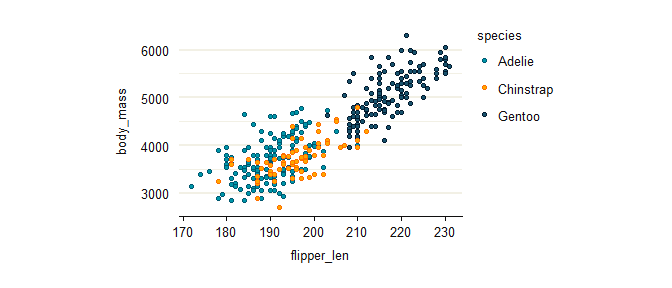
p <- mpg |>
  dplyr::count(class) |>
  dplyr::mutate(class = forcats::fct_reorder(class, n)) |>
  ggrefine() +
  aes(x = n, y = class, label = n) +
  geom_col(width = 0.7) +
  scale_x_zero() +
  scale_colour_blend_discrete() +
  refine_axis_grid(discrete = "y")

p +
  geom_text(aes_colour_contrast(), hjust = 1.25)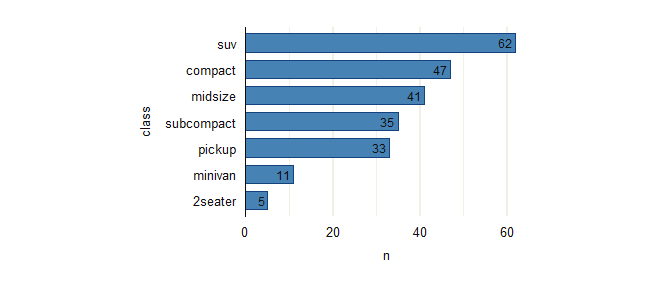
update_palette(fixed = jumble::navy)

p +
geom_text(aes_colour_contrast(), hjust = 1.25) 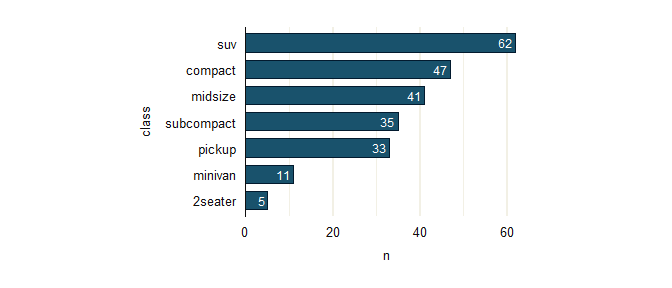
update_palette(discrete = jumble::jumble)

p +
  aes(fill = class) +
  geom_text(aes_colour_contrast(), hjust = 1.25) +
refine_legend(position = "top") 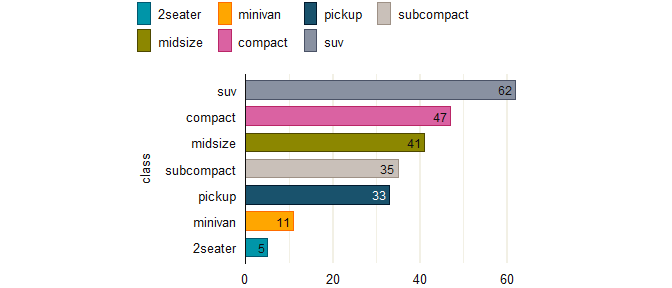
p +
  geom_text(aes(x = n + (max(n) * 0.05), !!!aes_colour_panel()))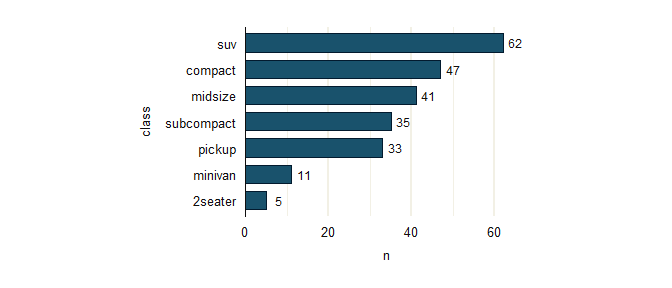
update_darks()

p +
  geom_text(aes(x = n + (max(n) * 0.05), !!!aes_colour_panel()))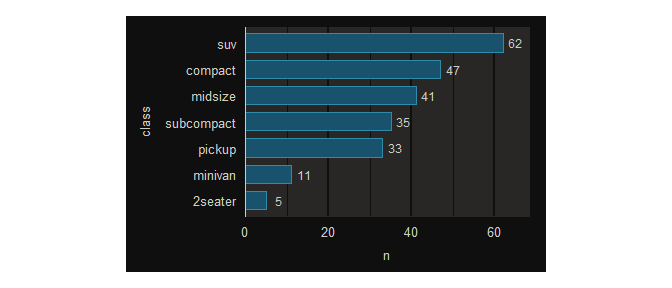
This package is part of a group of related packages built to extend ggplot2.

|

|

|

|

|

|
These binaries (installable software) and packages are in development.
They may not be fully stable and should be used with caution. We make no claims about them.
Health stats visible at Monitor.