

The hardware and bandwidth for this mirror is donated by dogado GmbH, the Webhosting and Full Service-Cloud Provider. Check out our Wordpress Tutorial.
If you wish to report a bug, or if you are interested in having us mirror your free-software or open-source project, please feel free to contact us at mirror[@]dogado.de.
ggpyramid is a ggplot2 extension for building population pyramids: back-to-back bar charts of a population by age group and sex. A pyramid is one more layer in an ordinary ggplot, so scales, facets, themes and further layers work as they do anywhere else in ggplot2.
Install the released version of ggpyramid from CRAN with:
install.packages("ggpyramid")Or the development version from GitHub with:
# install.packages("pak")
pak::pak("matanhakim/ggpyramid")geom_pyramid() draws the bars and
coord_pyramid() the axes. The bars sum a value when one is
mapped, as here, and count rows when it is not, so they accept
aggregated tables and individual records alike. europe_pop
holds the population of four European countries in 2004 and 2024, from
Eurostat.
library(ggplot2)
library(ggpyramid)

france <- subset(europe_pop, country == "France" & year == 2024)

ggplot(france, aes(x = population, y = age, fill = sex)) +
  geom_pyramid(width = 1, colour = "white") +
  scale_x_continuous(labels = scales::label_comma()) +
  coord_pyramid(age_axis = "centre") +
  labs(x = NULL, y = NULL, fill = NULL) +
  theme_pyramid()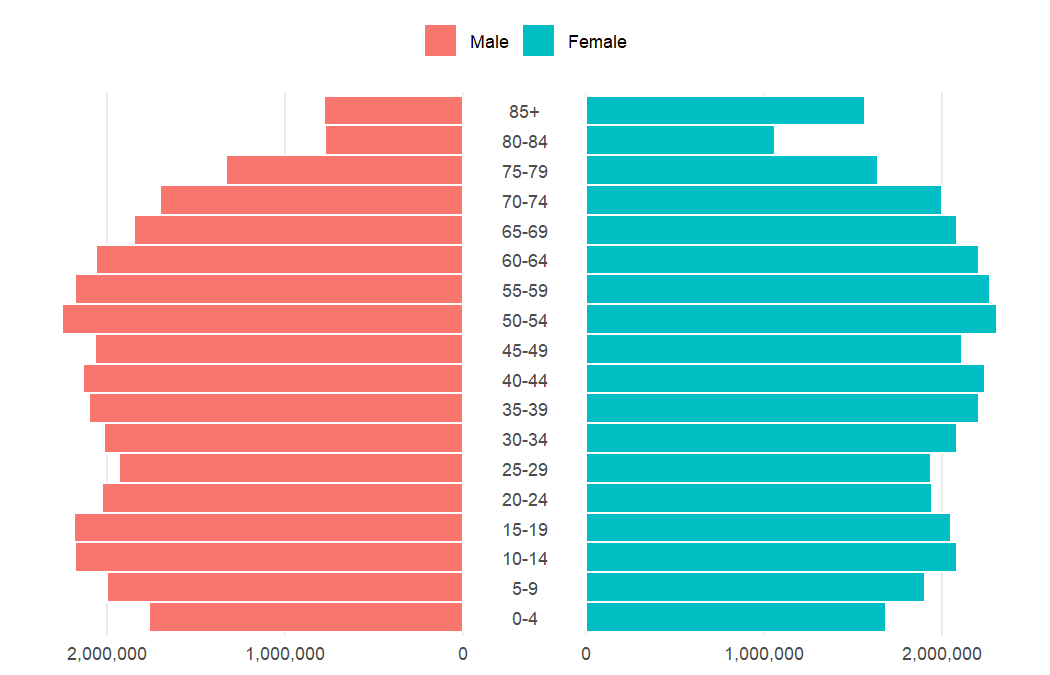
denominator turns the bars into shares of the panel or
of each side, and each facet gets its own denominator.
geom_pyramid_outline() draws a second population as a
stepped line over the bars:
ggplot(europe_pop, aes(x = population, y = age, fill = sex)) +
  geom_pyramid(data = ~ subset(.x, year == 2024), denominator = "total") +
  geom_pyramid_outline(data = ~ subset(.x, year == 2004), denominator = "total") +
  scale_x_continuous(labels = scales::label_percent()) +
  coord_pyramid() +
  facet_wrap(vars(country)) +
  labs(
    x = NULL,
    y = NULL,
    fill = "2024",
    caption = "Share of the population. The outline shows 2004."
  ) +
  theme_pyramid()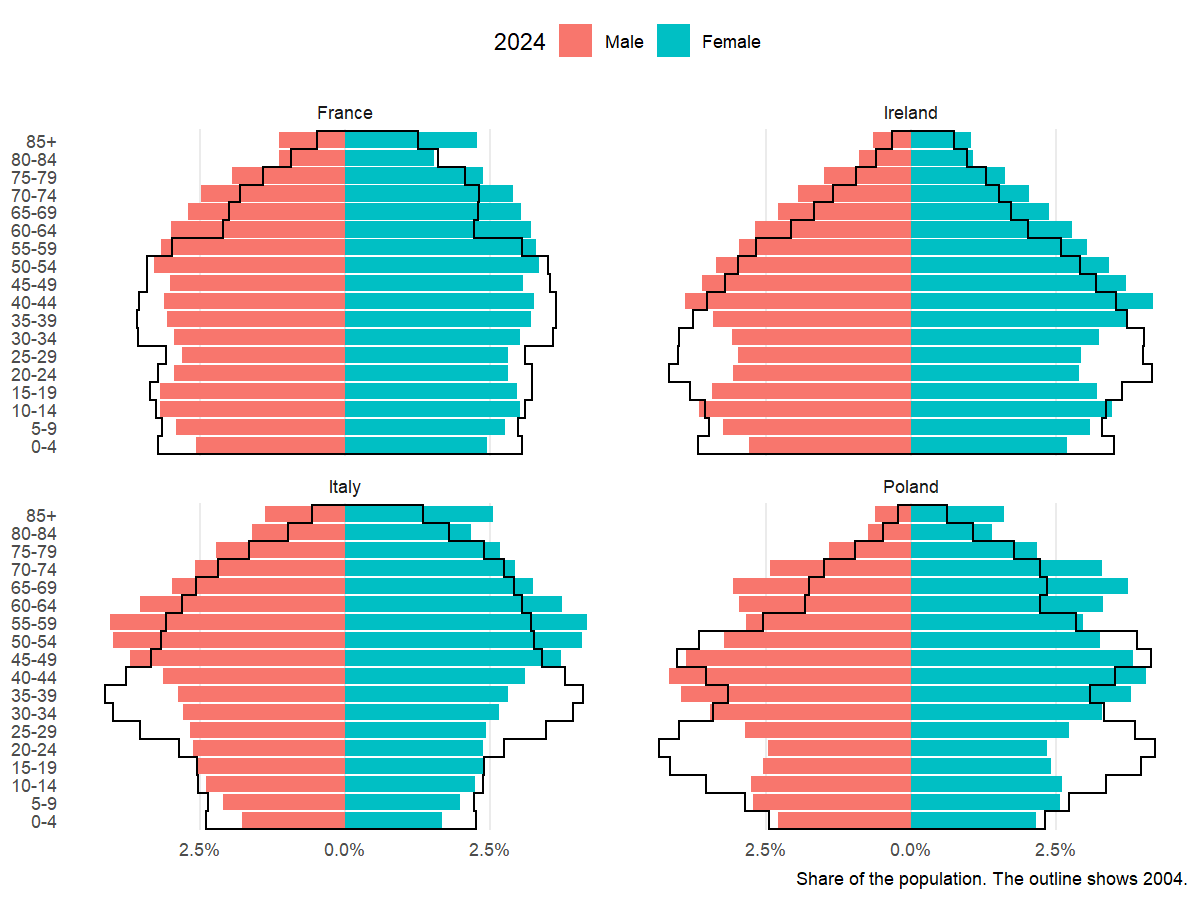
geom_pyramid_text() labels each bar at its end, on both
sides:
ireland <- subset(europe_pop, country == "Ireland" & year == 2024)

ggplot(ireland, aes(x = population, y = age, fill = sex)) +
  geom_pyramid(denominator = "side") +
  geom_pyramid_text(
    denominator = "side",
    labels = scales::label_percent(accuracy = 0.1),
    size = 2.6
  ) +
  scale_x_continuous(
    labels = scales::label_percent(),
    expand = expansion(mult = 0.15)
  ) +
  coord_pyramid(age_axis = "centre") +
  labs(x = "Share of each sex", y = NULL, fill = NULL) +
  theme_pyramid()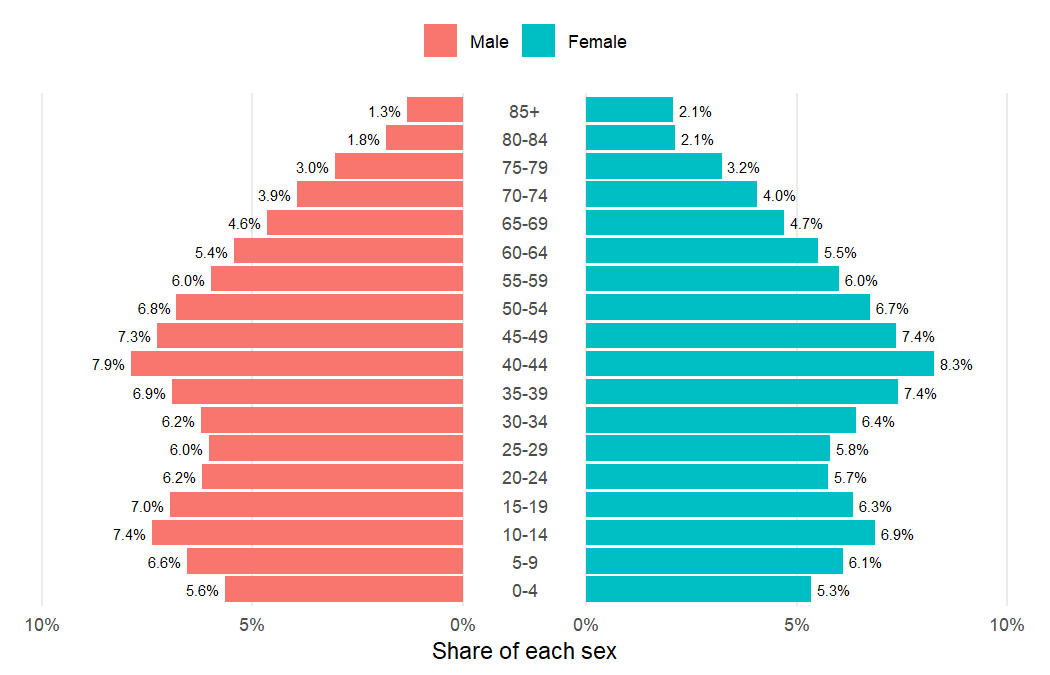
vignette("ggpyramid") covers the rest: placing the age
axis, subgroups within each side, vertical pyramids, and how the two
sides are drawn.
apyramid
builds a complete pyramid from one function call.
geom_pyramid() in ggstats is a layer
that mirrors bars by their position in a stack. ggpyramid takes the side
from a variable and adds the coordinate system, labels and outlines that
a pyramid needs, each as a separate ggplot2 component.
These binaries (installable software) and packages are in development.
They may not be fully stable and should be used with caution. We make no claims about them.
Health stats visible at Monitor.