The hardware and bandwidth for this mirror is donated by dogado GmbH, the Webhosting and Full Service-Cloud Provider. Check out our Wordpress Tutorial.
If you wish to report a bug, or if you are interested in having us mirror your free-software or open-source project, please feel free to contact us at mirror[@]dogado.de.
{ggpolar} provides a very flexible way to create dots in
coordinate system for event list and connect the dots with segments
based on {ggplot2}.
You can install the released version of {ggpolar} from
CRAN with:
install.packages("ggpolar")You can install the development version of {ggpolar}
from GitHub with:
remotes::install_github("ShixiangWang/polar")library(ggpolar)
#> Loading required package: ggplot2
data <- data.frame(x = LETTERS[1:7])
p1 <- polar_init(data, x = x)
p1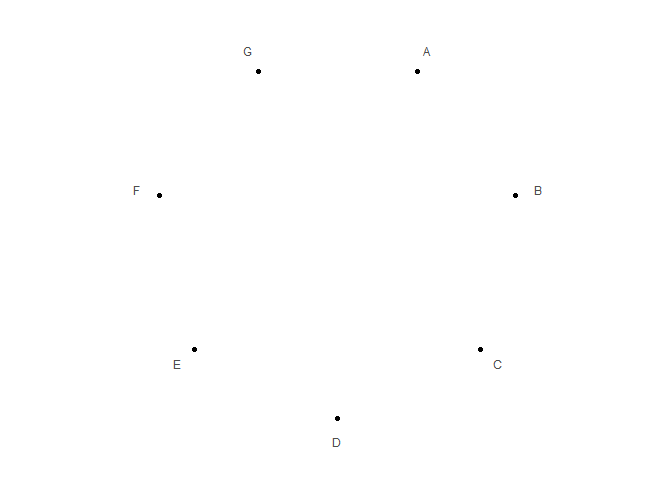
# Set aes value
p2 <- polar_init(data, x = x, size = 3, color = "red", alpha = 0.5)
p2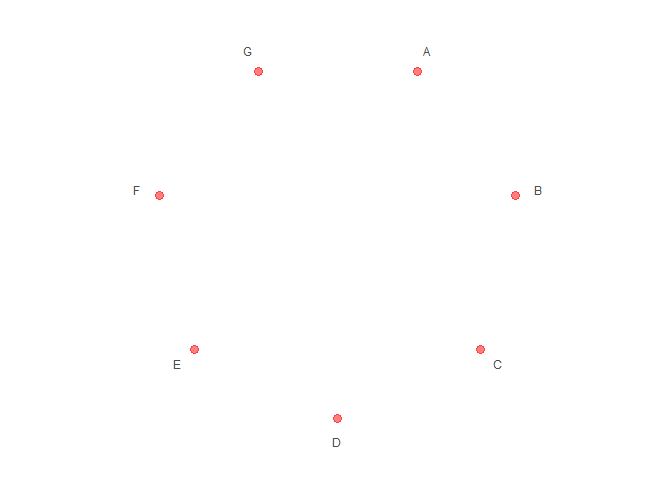
# Set aes mapping
set.seed(123L)
data1 <- data.frame(
  x = LETTERS[1:7],
  shape = c("r", "r", "r", "b", "b", "b", "b"),
  color = c("r", "r", "r", "b", "b", "b", "b"),
  size = abs(rnorm(7))
)
# Check https://ggplot2.tidyverse.org/reference/geom_point.html
# for how to use both stroke and color
p3 <- polar_init(data1, x = x, aes(size = size, color = color, shape = shape), alpha = 0.5)
p3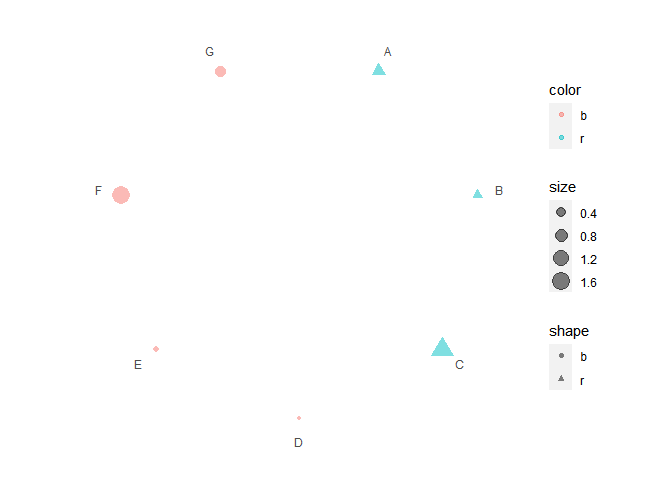
data2 <- data.frame(
  x1 = LETTERS[1:7],
  x2 = c("B", "C", "D", "E", "C", "A", "C"),
  color = c("r", "r", "r", "b", "b", "b", "b")
)
p4 <- p3 + polar_connect(data2, x1, x2)
p4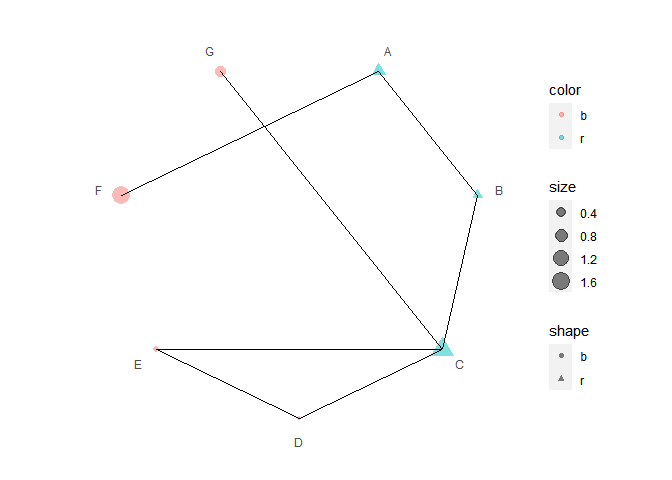
# Unlike polar_init, mappings don't need to be included in aes()
p5 <- p3 + polar_connect(data2, x1, x2, color = color, alpha = 0.8, linetype = 2)
p5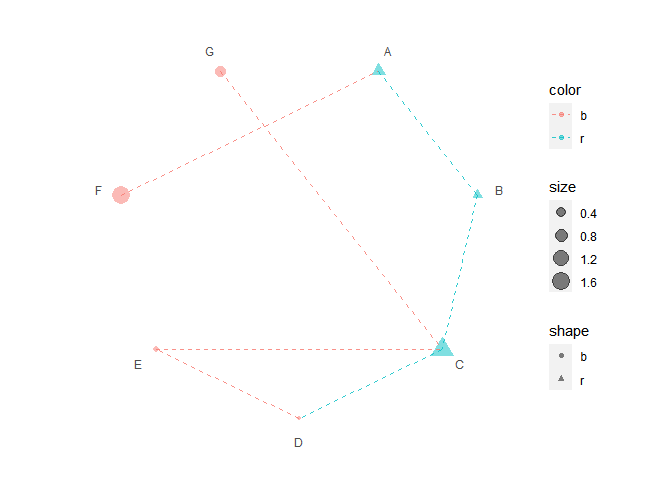
# Use two different color scales
if (requireNamespace("ggnewscale")) {
library(ggnewscale)
p6 = p3 +
new_scale("color") +
polar_connect(data2, x1, x2, color = color, alpha = 0.8, linetype = 2)
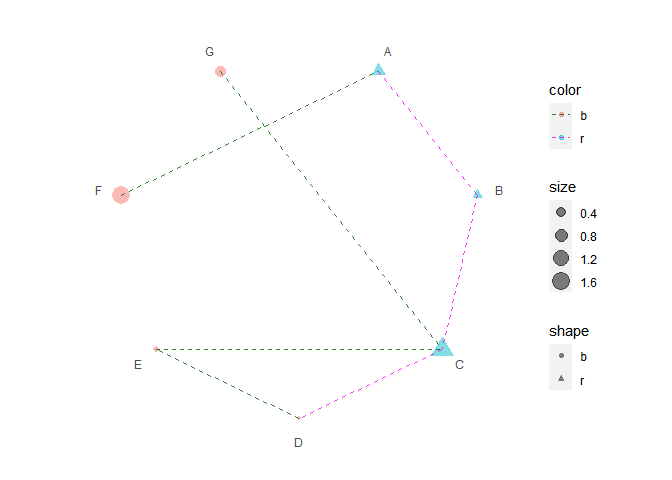
print(p6 + scale_color_brewer())
print(p6 + scale_color_manual(values = c("darkgreen", "magenta")))
}
#> Loading required namespace: ggnewscale
#> Warning: package 'ggnewscale' was built under R version 4.2.1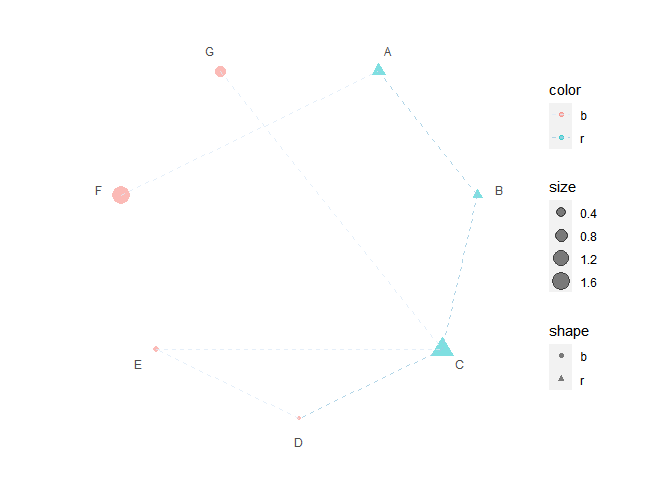
If you use {ggpolar} in academic research, please cite
the following paper along with the GitHub repo.
Antigen presentation and tumor immunogenicity in cancer immunotherapy response prediction, eLife. https://doi.org/10.7554/eLife.49020.
These binaries (installable software) and packages are in development.
They may not be fully stable and should be used with caution. We make no claims about them.
Health stats visible at Monitor.