ggmultiglyph:
Multivariate Data Visualization using Glyphs
The hardware and bandwidth for this mirror is donated by dogado GmbH, the Webhosting and Full Service-Cloud Provider. Check out our Wordpress Tutorial.
If you wish to report a bug, or if you are interested in having us mirror your free-software or open-source project, please feel free to contact us at mirror[@]dogado.de.
ggmultiglyph:
Multivariate Data Visualization using Glyphs
Division of Germplasm Conservation, ICAR-National Bureau of Plant Genetic Resources, New Delhi.









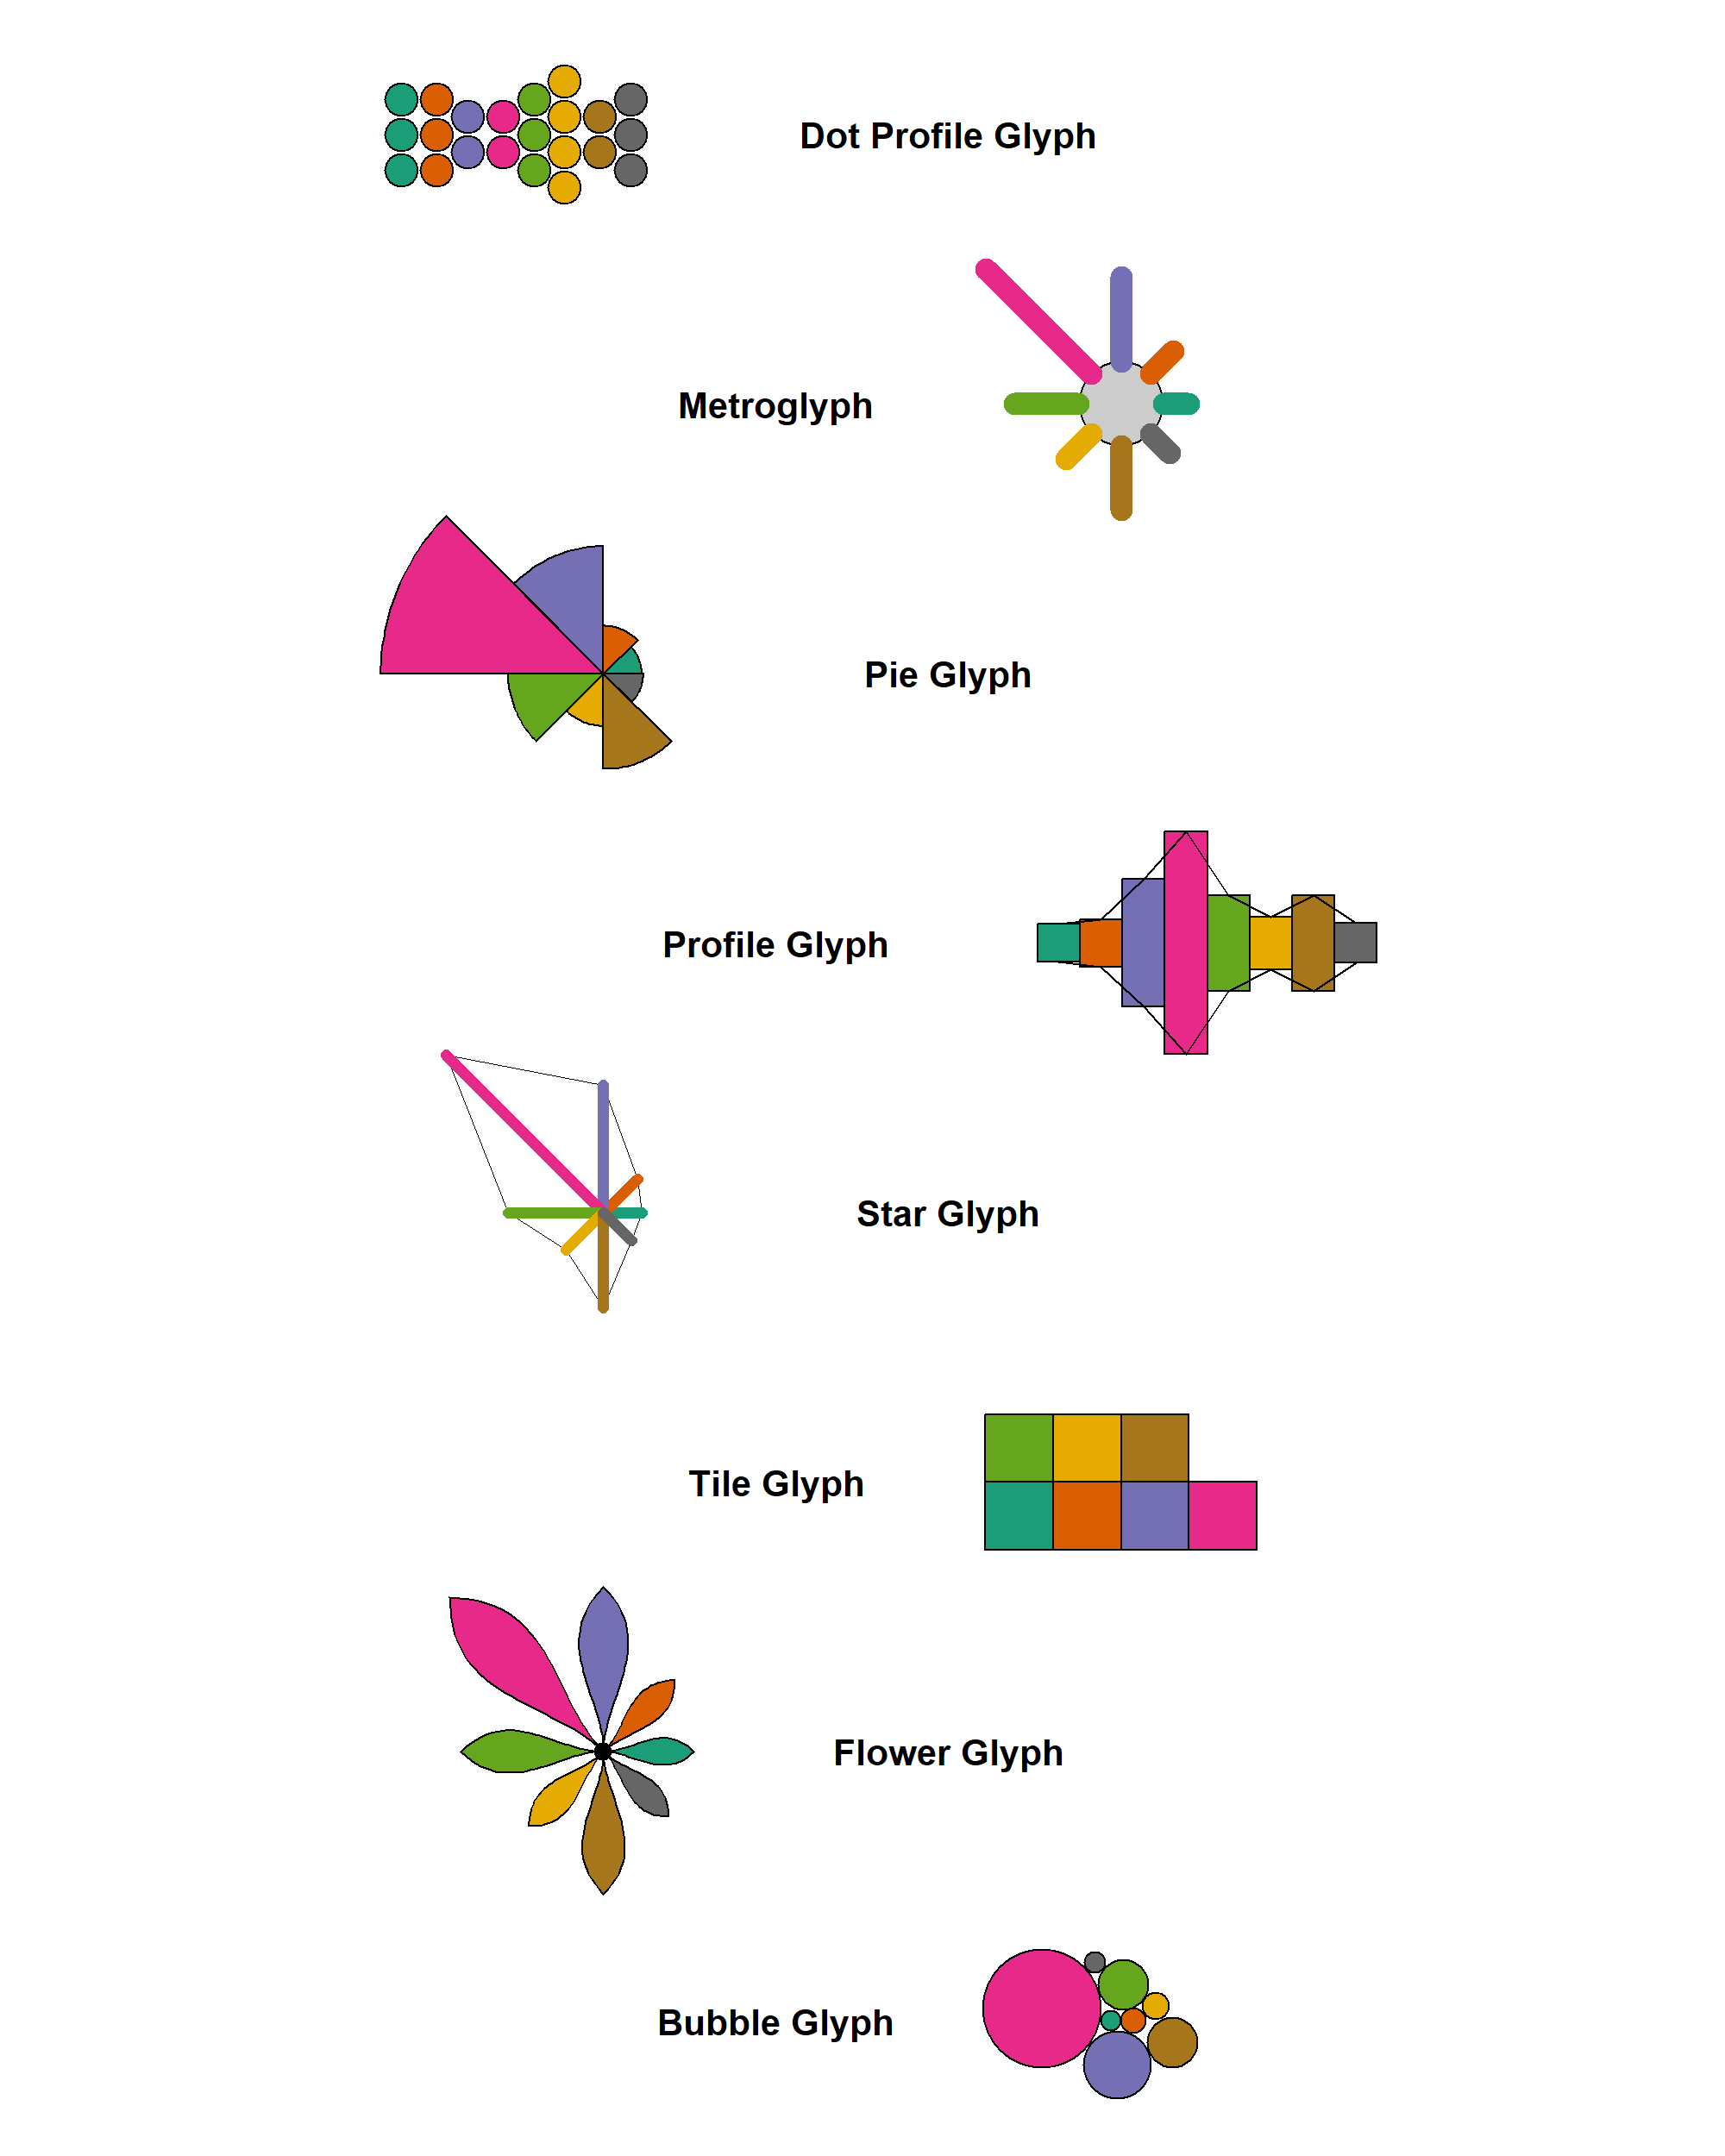
Provides ‘ggplot2’ geoms for visualizing multivariate data using glyphs. The package implements several established glyph designs described in the information visualization literature, including the review by Borgo et al. (2013) doi:10.2312/conf/EG2013/stars/039-063.
The development version can be installed from github as follows:
# Install development version from Github
devtools::install_github("aravind-j/ggmultiglyph")To know whats new in this version type:
news(package='ggmultiglyph')ggmultiglyphTo cite the methods in the package use:
citation("ggmultiglyph")To cite the R package 'ggmultiglyph' in publications use:
Aravind, J. (2026). ggmultiglyph: Multivariate Data Visualization using Glyphs. R package version 0.1.0,
https://aravind-j.github.io/ggmultiglyph/.
A BibTeX entry for LaTeX users is
@Manual{,
title = {ggmultiglyph: Multivariate Data Visualization using Glyphs},
author = {J. Aravind},
note = {R package version 0.1.0 https://aravind-j.github.io/ggmultiglyph/},
year = {2026},
}
This free and open-source software implements academic research by the authors and co-workers. If you use it, please support the
project by citing the package.These binaries (installable software) and packages are in development.
They may not be fully stable and should be used with caution. We make no claims about them.
Health stats visible at Monitor.